
US STOCKS OUTLOOK:
- S&P 500 and Nasdaq 100 rise for second day in a row despite negative GDP data
- Bets that the Federal Reserve will soon pivot to less aggressive monetary policy amid rising recession risks fuel optimism on Wall Street
- All eyes will be on the June core PCE report, to be released on Friday
Trade Smarter - Sign up for the DailyFX Newsletter
Receive timely and compelling market commentary from the DailyFX team
Most Read: Fed Raises Rates by 75 Basis Points at July FOMC in Fight to Quell Inflation
After suffering big losses in the early trade, U.S. stocks scored sharp intraday reversals and managed to extend the Fed-induced rally from the previous session, gaining ground for the second day in a row despite disappointing economic data, such as the latest gross domestic product report.
At the market close, the S&P 500 advanced 1.21% to 4,072, its best level since June 9, powered up by a strong upswing in Microsoft and Tesla shares. The Nasdaq 100, for its part, erased a 1.5% decline and climbed 0.92% to 12,718, bolstered by a pull-back in Treasury rates, with the 10-year yield briefly falling to 2.65%, its lowest reading since mid-April.
Sentiment remained upbeat on Wall Street after the Federal Reverse delivered no new hawkish bombshells at the conclusion of its FOMC meeting Wednesday and said that unusually large hikes will depend on data going forward, a sign that policymakers could slow the pace of rate increases in the future.

On the economic front, U.S. GDP registered a further contraction in the second quarter, down 0.9% in annualized terms following a 1.6% decline in the first three months of the year. While the deteriorating growth profile is not cause for celebration, investors are speculating that the bad news may be good news in the sense that a downturn could prompt the U.S. central bank to adopt a less hawkish stance sooner-than-anticipated, a scenario that could support a sustainable recovery in risk assets.
The bullish tone was later reinforced after U.S. Treasury Secretary Janet Yellen offered positive comments on the outlook, saying the economy remains resilient and the labor market strong, helping to ease fears of an impending recession.
Looking ahead, the earnings season will continue to garner most of the attention as investors look for clues on the impact of high inflation, slowing demand and tightening financial conditions on Corporate America. On Friday, however, all eyes will be on the core PCE report, the Fed's favorite inflation gauge (this indicator is seen rising 0.5% m/m and 4.7% y/y). For market sentiment to improve further, the data will have to show a significant moderation in price growth, but that is unlikely to happen until later this summer.
| Change in | Longs | Shorts | OI |
| Daily | -5% | 0% | -3% |
| Weekly | 23% | -14% | 1% |
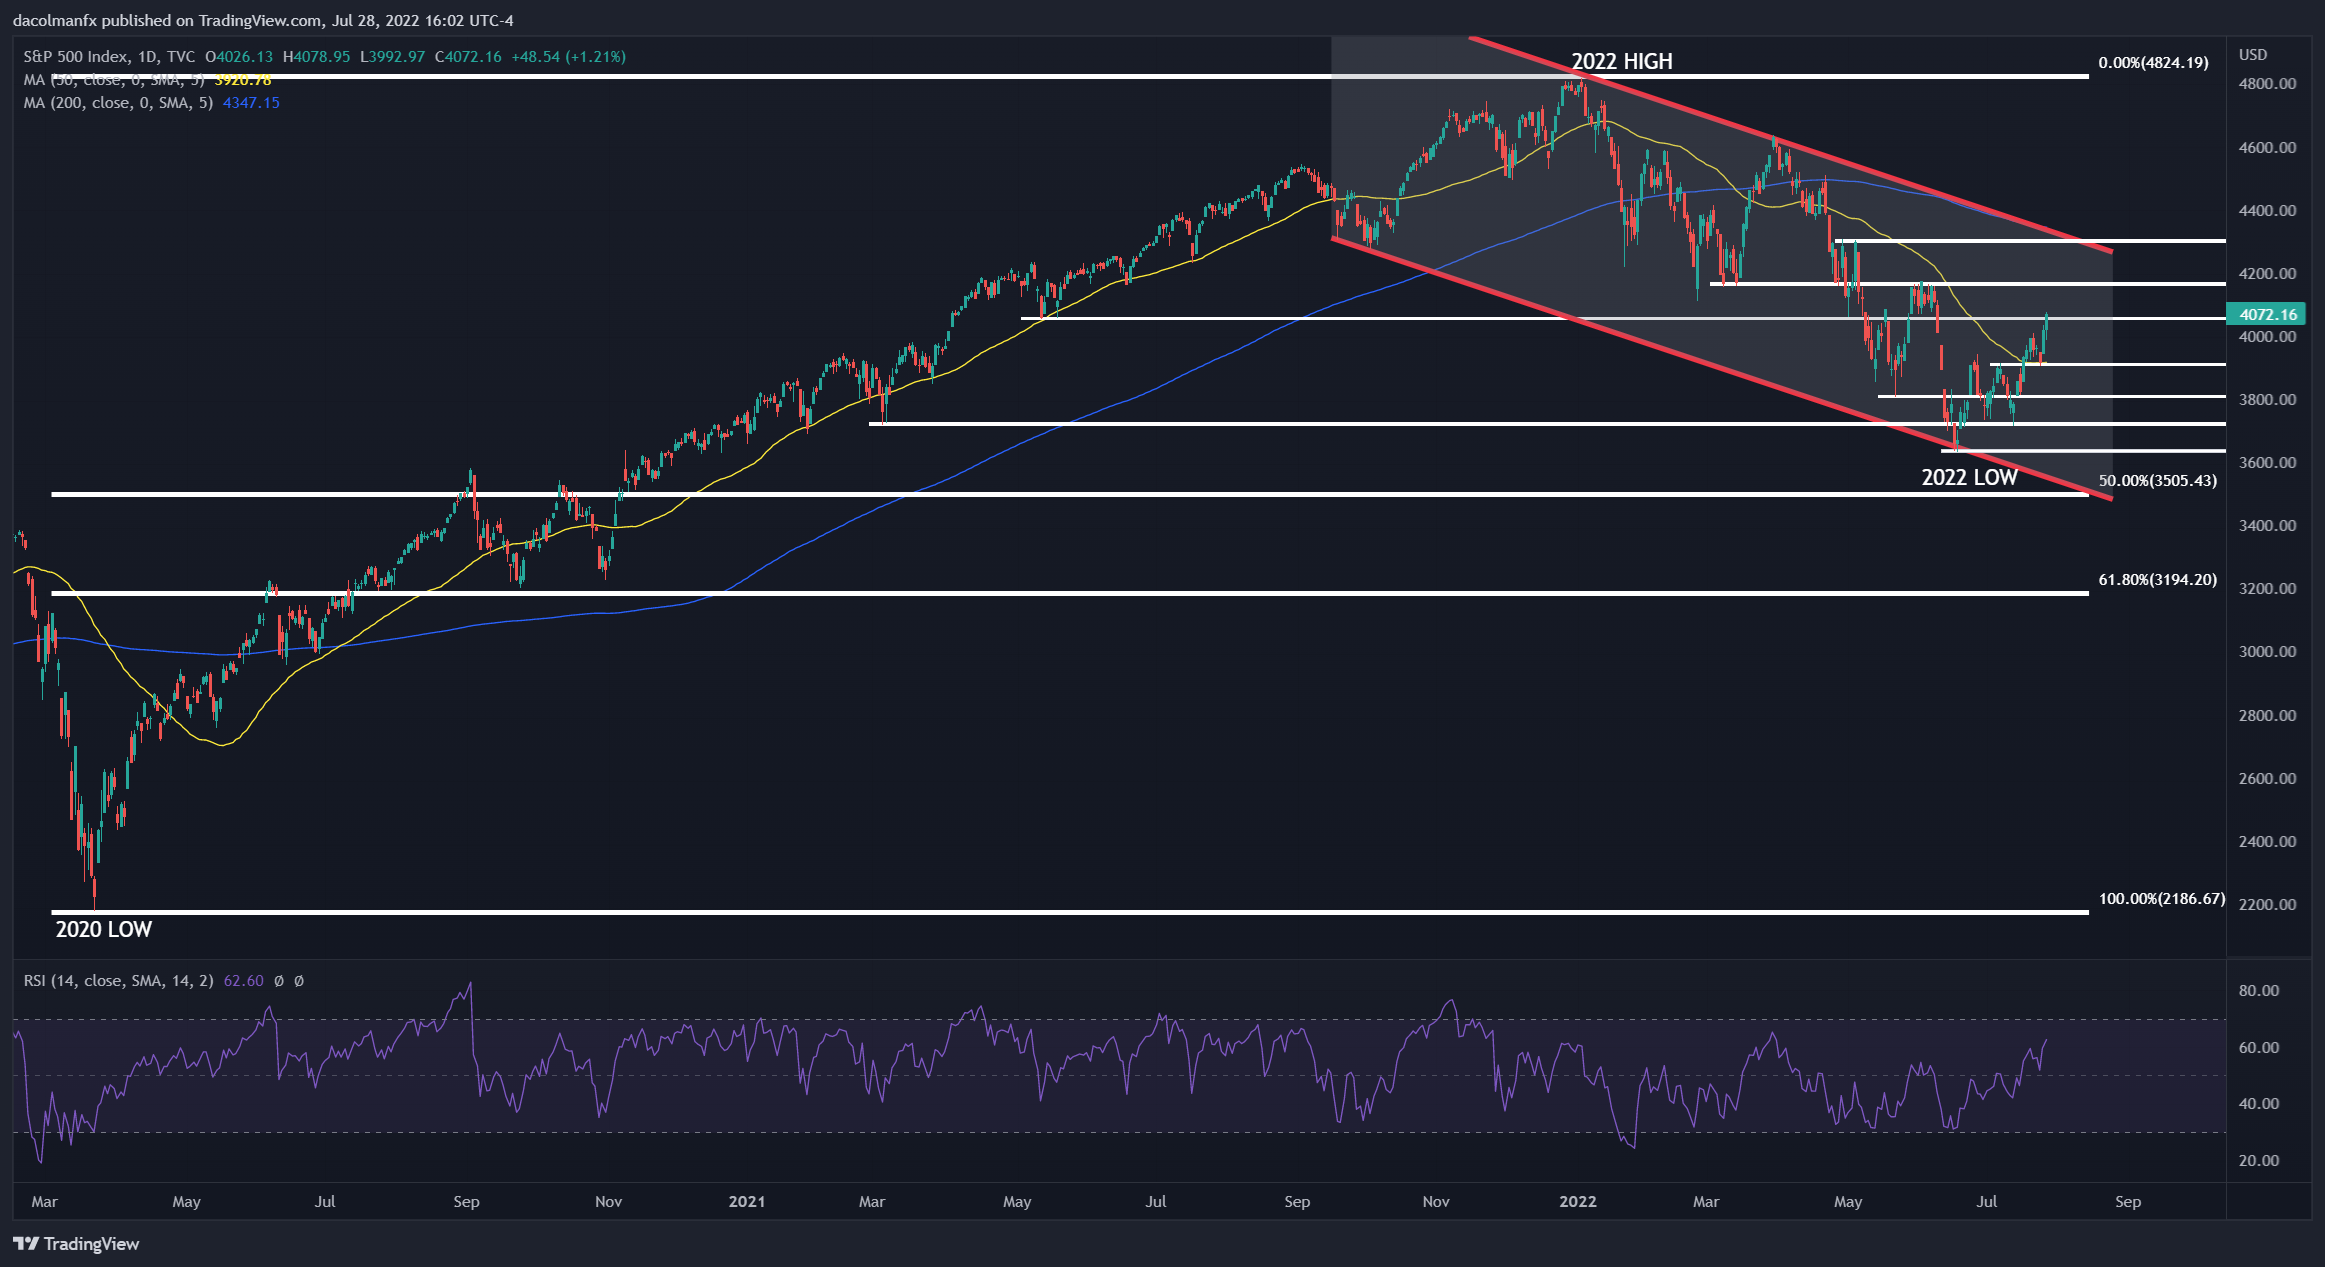
S&P 500 TECHNICAL CHART
After a strong day on Thursday, the S&P 500 managed to breach a key ceiling near 4,065, a move that allowed prices to rise to the highest level since June 9. With sentiment on the mend and today’s bullish breakout, the index may soon find momentum to mount an attack on the 4,160/4,175 area, the next technical barrier in play. On further strength, the focus shifts to channel resistance near the psychological 4,300 level. On the flip side, if sellers return to fade the recent rally, initial support appears at 4,065, followed by 3,920. If both floors are invalidated, a pullback towards 3,815 should not be ruled out.
S&P 500 TECHNICAL CHART