


S&P 500 ANALYSIS, CHINA TARIFFS, US CPI DATA, FED POLICY, INFLATION - TALKING POINTS
- S&P 500 may rise if President Joe Biden rolls back some of tariffs on China
- Equity market benchmark may erase gains if US CPI data exceeds estimates
- SPX outlook bearish as technicals appear to show no sign of major reversal

The S&P 500 index could experience whiplash this week, between a potential update on the Biden administration pulling tariffs back on $10 billion worth of Chinese goods and US CPI data. While the VIX is close to a one-month low, the underlying trend since April suggests volatility could continue to escalate in the coming days and weeks. What might trigger the next spike?
BIDEN MAY LIFT CHINA TARIFFS
In 2018, then-President Donald Trump imposed over $300 billion worth of tariffs on Chinese goods, citing Section 301 of the Trade Act of 1974. This legal protocol:
“grants the Office of the United States Trade Representative (USTR) a range of responsibilities and authorities to investigate and take action to enforce U.S. rights under trade agreements and respond to certain foreign trade practices”.
However, with inflation now at multi-decade highs, US President Joe Biden is considering rolling back some of these trade taxes to alleviate the pain of price growth on households. The administration is reviewing them “one at a time”, due to the complexity of the material and (arguably most importantly) the geopolitical implications of their repeal.
For more updates on geopolitical risks, follow me on Twitter @ZabelinDimitri.
Competing with China and pushing back against Beijing’s attempts to expand its sphere of influence is a top foreign policy priority for President Biden. The recent $600 billion global infrastructure plan, the Indo-Pacific Economic Framework, and the Comprehensive and Progressive Trans-Pacific Partnership (CPTPP) trade agreement highlight as much, as do many other initiatives.
Consequently, Washington will likely want to be cautious in how it exercises its economic levers, specifically tariffs. In the current macroeconomic environment of high inflation and tightening credit conditions, the financial pain from such a policy is amplified.
READ MORE: How to Trade the Impact of Politics on Global Financial Markets
Within the administration, there are competing frameworks between Treasury Secretary Janet Yellen and USTR Katherine Tsai. The former appears to favor tariff reductions, while the latter has strongly emphasized the duties regime as a “significant piece of leverage” that Washington can use to extract concessions from China.
From a domestic point of view, tariffs could be a politically attractive policy move to use if they reduced inflationary pressure on key household items (such as electronics) ahead of the midterm elections. There are also labor unions to consider, who are in favor of keeping the tariffs in place. Going against that gradient could risk political blowback by a key constituency of Mr. Biden.
From this perspective, the decision to roll back Chinese tariffs is a dichotomy of competing domestic and foreign policy priorities.
If tariff reductions are announced, the S&P 500 may rise in proportion to the magnitude of the cutbacks. Investors may interpret this policy measure as having a knock-on effect for reducing inflationary pressure, and by extension, the impetus for the Fed to aggressively raise rates. But what if this week’s CPI data overshadows it?
Foundational Trading Knowledge
Forex Fundamental Analysis
Recommended by Dimitri Zabelin
US CPI DATA: WHAT TO EXPECT
Economists are estimating for inflation to rise to 8.8% on a year-on-year basis for June, surpassing May’s print of 8.6%. The steep incline in price growth started around May of 2020, with a brief period of respite between September and December in that same year. Since then however, inflation has skyrocketed.
US CPI (% y/y, 1950-present)
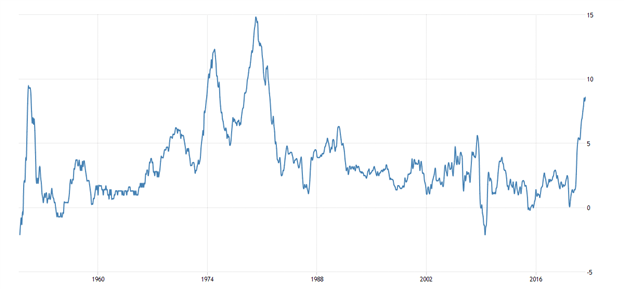
Source: TradingEconomics
This appears to be a function of both cost-push factors – like post-Covid supply chain disruptions – and demand-pull dynamics. This is where demand grows faster than supply. More money chasing fewer goods bids up their prices. Since the pandemic started, governments and central banks have injected trillions of dollars into the economy to support demand, but the mechanisms for delivering on it for consumers have struggled to function smoothly.
With inflation now looking far from “transitory”, Fed officials have hiked rates by as much as 75 basis points at a time (as they did in June for the first time in almost a third of a century). Interest rate futures show markets have almost priced in another 75 basis point hike for July. What the upcoming CPI data is will likely help determine if such bets hold up or face repricing.
If CPI data exceeds the 8.8% forecast, the S&P 500 may experience a sharp decline at the same time that interest rate futures may tick higher to reflect expectations of another 75 bps hike. While the VIX is trading at its lowest point since June 9, that could drastically change, potentially setting the benchmark equity index up for another painful descent.
VIX - Daily Chart
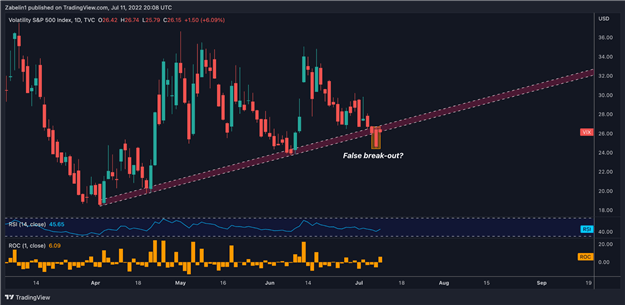
Vix chart created using TradingView
S&P 500 TECHNICAL ANALYSIS
The S&P 500 recently bounced from a multi-month low of 3642.31, and has since risen just under six percent. The next ceiling it may need to clear appears to be 3981.88, where the benchmark equity index briefly stalled on its ascent in May and its sharp descent in June when it gapped lower on several days.
S&P 500 - Daily Chart
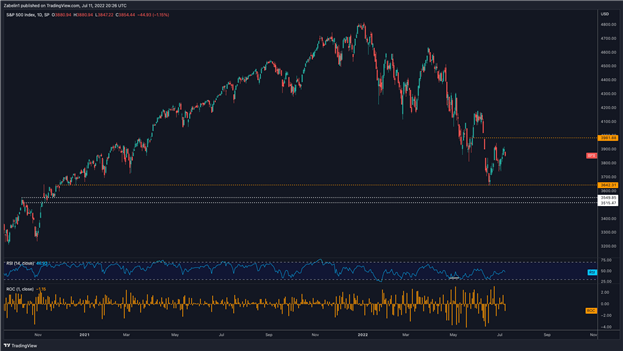
S&P 500 chart created using TradingView
Looking ahead, if the index is not able to clear 3981.88, it could cast a bearish shadow and undermine confidence in the S&P 500’s short-term trajectory. That acknowledgement could be reflected in a sharp decline as sellers double down on their bearish outlook. A retest of recently-tested support at 3642.31 could be in the cards again.
Trade Smarter - Sign up for the DailyFX Newsletter
Receive timely and compelling market commentary from the DailyFX team


