


The second quarter of 2022 worked out as anticipated in the 2Q’22 Top Trading Opportunities: the US S&P 500 continued to outperform the US Nasdaq 100; EUR/USD rates broke through their March 2020 pandemic low at 1.0636; and the US Treasury yield curve (2s10s) moved into inversion territory. More central banks began to aggressively raise interest rates while fiscal stimulus was nowhere in sight.
But the factors that underlined the drivers of price action in 1Q’22 and 2Q’22 may have run their course. While the Federal Reserve has become increasingly aggressive with respect to raising interest rates, Fed rate hike odds appear to have started to roll over. Inflation expectations across developed economies have stabilized, suggesting that markets believe the current rise in living costs is nearing the end of their ascent. While the US economy may have contracted for a second consecutive quarter in 2Q’22, the prospect of supply chain disruptions and weaker Chinese growth may be reduced as China’s zero-COVID strategy shifts away from overbearing lockdowns; global growth should be on modestly better footing.
As far as 3Q’22 goes, these factors suggest that more optimistic times are ahead for global financial markets – even if economic data remains weak and sentiment struggles. After all, markets tend to bottom before economies do, which will create cognitive dissonance for many market participants (particularly newer retail traders).
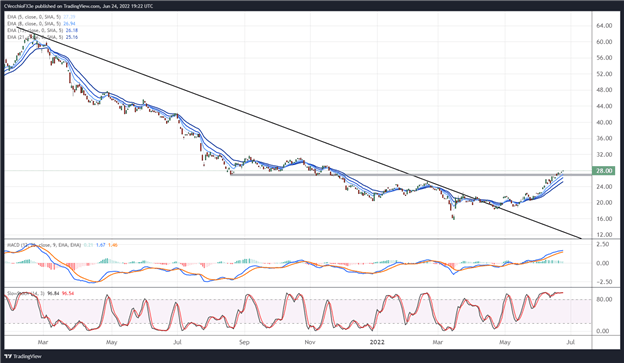
CHINA NASDAQ GOLDEN DRAGON INDEX VERSUS US NASDAQ (ETF: HXC/QQQ) TECHNICAL ANALYSIS: DAILY CHART (January 2021 to June 2022)
Source: TradingView
As bad as US equity markets have been in 2022, Chinese equity markets have had it much worse since early-2021. Lacking an effective vaccine and resorting to draconian lockdowns, the Chinese economy has proved disappointing for the past 18 months. But now that China’s zero-COVID strategy is evolving away from sweeping lockdowns and an Omicron-specific vaccine is on the verge of being rolled out, the worst may be over for Chinese stocks. After basing for the past six months, the long HXC/short QQQ ratio has started to turn higher, suggesting a period of outperformance for Chinese stocks relative to US stocks for at least the next few months. The ratio may rise from around 28 to 36 during 3Q’22.
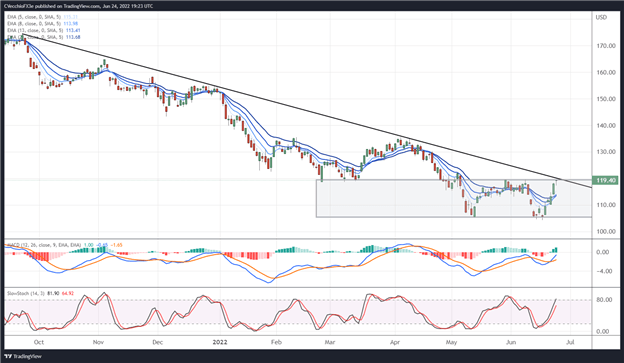
iSHARES BIOTECHNOLOGY (ETF: IBB) TECHNICAL ANALYSIS: DAILY CHART (June 2021 to June 2022) (CHART 2)
Source: TradingView
If US inflation and growth fears have peaked, then out-of-vogue sectors – those that are economically-sensitive – should perform better in the coming months. One of the poster children of risk appetite in US equity markets is the biotech sector, which has been forming a double bottom base over the past two months. Coupled with a break of the downtrend from the September 2021, December 2021, and April 2022 highs, IBB could trade from 119.40 to 135.57 during 3Q’22.
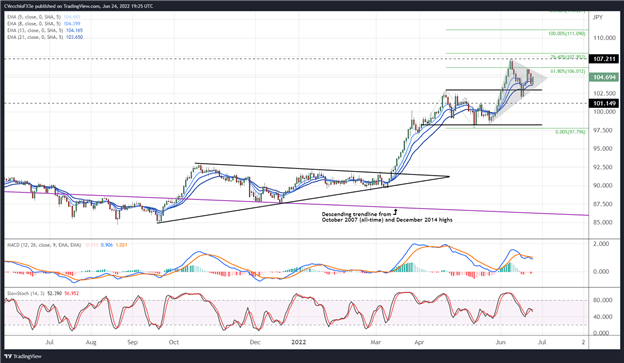
CAD/JPY TECHNICAL ANALYSIS: DAILY CHART (JUNE 2020 to JUNE 2022) (CHART 3)
Source: TradingView
CAD/JPY rates pulled back over the past two weeks after breaking their December 2014 high, trading to their highest level since February 2008. But support was found at former resistance of the range that began in April 2022, suggesting that the technical posture remains bullish. The aforementioned range called for a measured move higher above 108.00, which has not yet been achieved, thus exists the potential for another swing higher before exhaustion transpires. A move back above the June high at 107.21 would offer a strong confirmation signal that the next leg higher has commenced, targeting the 100% Fibonacci extension of the March 2022 low/April 2022 high/May 2022 low range at 111.09.


