
US STOCKS OUTLOOK:
- U.S. stocks erase Wednesday’s gains and turn sharply lower
- The S&P 500 plummets more than 3% and hits new 2022 lows
- Selling activity on Wall Street appears to be triggered by fears that the U.S. economy is headed for a recession
Trade Smarter - Sign up for the DailyFX Newsletter
Receive timely and compelling market commentary from the DailyFX team
Most Read: Fed Raises Rates by 75 Basis Points in Largest Hike Since 1994 in Effort to Crush Inflation
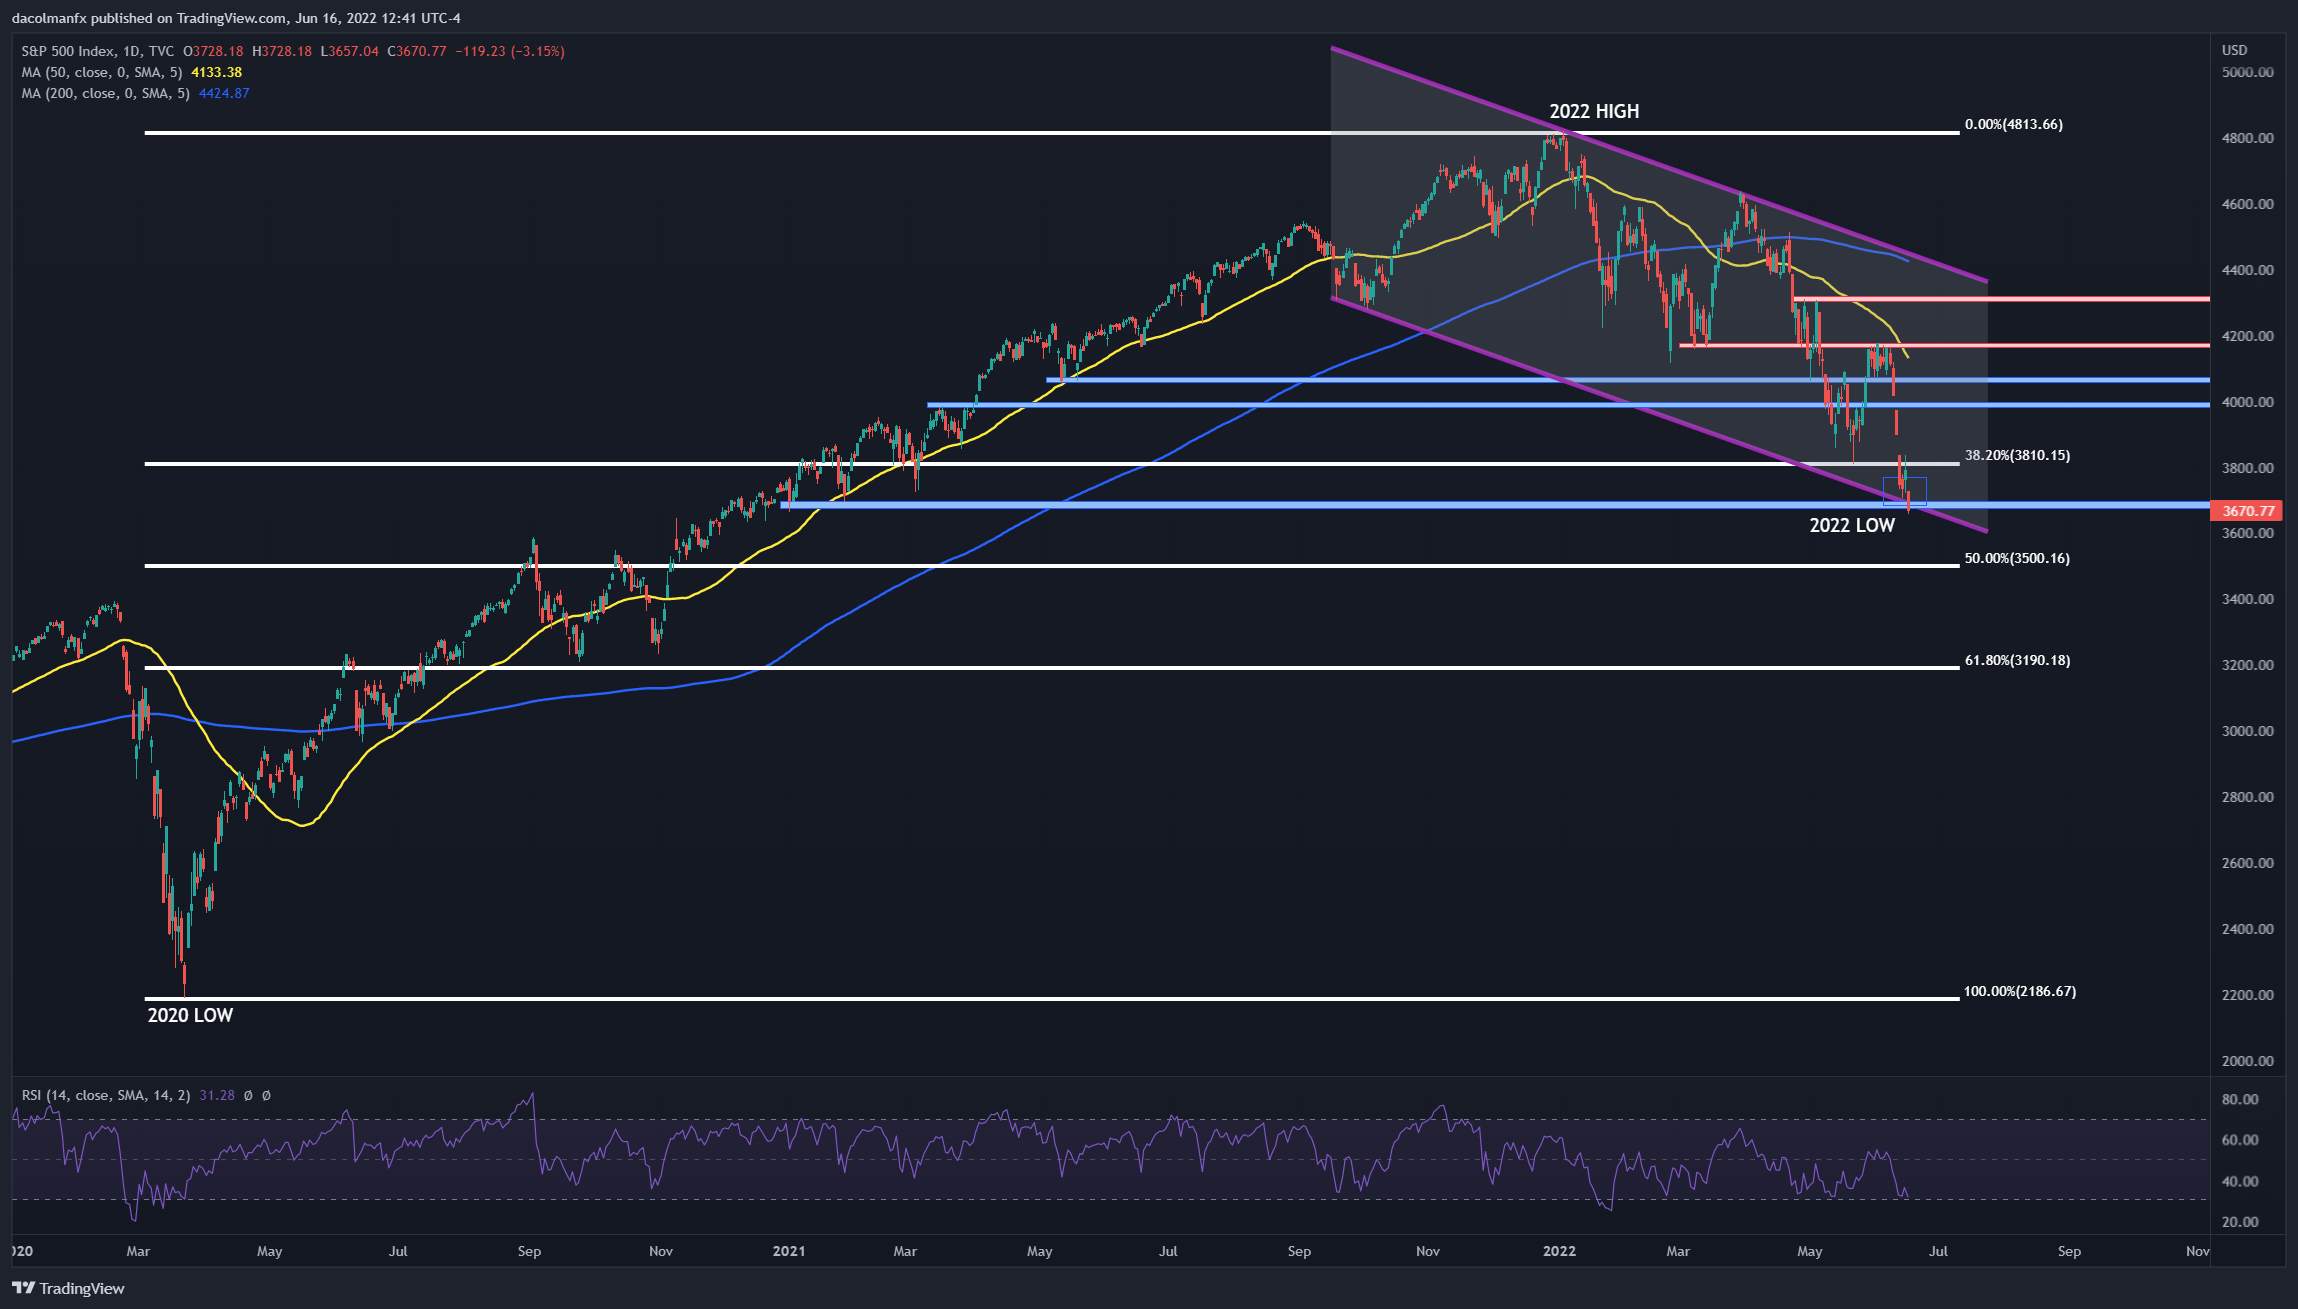
Bullish sentiment didn’t last long on Wall Street. After Wednesday’s brief relief rally, U.S. stocks took a sharp turn to the downside Thursday, with most sectors selling off violently amid growing recession anxiety. At the time of writing, the S&P 500 has given up all of the previous session's gains and more, losing roughly 3% and setting a new 2022 low around 3,660.
Yesterday, the Fed raised its benchmark rate by 75 basis points to 1.50-1.75%, delivering its largest hike since 1994, but the forceful measure failed to spark a negative reaction as Chair Powell clarified during his press conference that moves of that size would not be common.
By not endorsing an uber-hawkish approach, Powell calmed some nerves temporarily, but the mood has soured again as traders begin to acknowledge that the central bank’s remains on course to remove accommodation aggressively over the forecast horizon. For context, 150 basis points of additional tightening is expected for the remainder of the year. This should take the federal funds rate above neutral and into restrictive territory late in 2022, creating headwinds for risk assets.

Restrictive monetary policy at a time of slowing activity will become an additional drag on economic growth, increasing the likelihood of a hard landing in the medium term. Recession fears were heightened this morning after interest rates on 30-year mortgages in the U.S. soared to a nearly 14-year high of 5.78% and May new-home construction plunged 14.4%, sinking to the lowest level since April 2020, a clear sign of trouble for the housing sector.
Looking ahead, there is little reason to be optimistic about the outlook for the S&P 500 for now. While bear market rallies are difficult to time and cannot be ruled out, the overall trading bias remains tilted to the downside for the world’s top equity index. That said, the next significant leg lower could develop soon if U.S. companies begin issuing negative profit warnings ahead of the second-quarter earnings season. Traders should pay close attention to any guidance offered in the coming days to gauge the strength of Corporate America amid weakening GDP growth, inflation headwinds and tighter financial conditions.
| Change in | Longs | Shorts | OI |
| Daily | 2% | -5% | -2% |
| Weekly | 20% | -14% | -1% |
S&P 500 TECHNICAL ANALYSIS
Wednesday’s rally was nothing but another dead-cat bounce. Today, the S&P 500 is down more than 3% and has broken below channel support at 3,735/3,700, though the trading session is not yet over. If prices close below this area on Thursday, the next downside focus shifts to 3,500, a key floor created by the 50% Fibonacci retracement of the 2020/2022 rally. On the off chance of a rebound, initial resistance appears at 3,810, followed by 4,000.
S&P 500 TECHNICAL CHART