
US STOCKS OUTLOOK:
- S&P 500 falls for the second day in a row, but finishes well off its session's worst levels
- Strong ISM manufacturing data in the U.S. boosts Treasury yields, sparking speculation that the Fed will have to continue hiking rates aggressively to cool demand and tame inflation
- This article looks at the key technical levels to watch for in the S&P 500 over the next few days
Trade Smarter - Sign up for the DailyFX Newsletter
Receive timely and compelling market commentary from the DailyFX team
Most Read: US Dollar Price Action Setups - EUR/USD, GBP/USD, AUD/USD, USD/JPY
The S&P 500 lost ground for the second consecutive day, but managed to finish well off its session low near 4,073. At the market close, the world's most important equity benchmark index retreated 0.75% to 4,101, weighed down by higher U.S. government rates. For context, Treasury rates shot up across the curve driven by strong U.S. economic data, with the 2-year and 10-year yield rising approximately 10 basis points to 2.66% and 2.94% respectively, their highest level in about two weeks.
Earlier in the day, U.S. May ISM manufacturing surprised to the upside, rising to 56.1 from 55.4 in April, versus expectations for a decline to 54.5. While robust activity in the goods-producing sector is positive for the economy, Wall Street took the survey as "bad news" insofar as it suggests that the Fed's current tightening cycle has not done enough to cool demand, an important requirement for curbing red-hot inflation.
The FOMC raised borrowing costs by half a percentage point last month and signaled that it will continue front-loading hikes at that pace at its June and July meetings. Now, however, with the economy still on sturdy footing, the market is bracing for the possibility of another non-standard 50 basis points adjustment in September, with traders assigning a 60% probability to that scenario, up from 35% one week ago.

If hawkish monetary policy expectations solidify and yields continue to charge higher in the coming days and weeks, stocks will have a hard time recovering on a sustained basis, especially those in the growth and tech space with long-duration cash flows. Equities, however, may stabilize and stop the bleeding if incoming data remains resilient, a situation that will reduce the likelihood of a recession.
Looking ahead, there are no major events on the U.S. calendar tomorrow, but there will be two high-impact releases on Friday: 1) the May Non-farm payrolls report, and 2) the May ISM Non-Manufacturing survey. For sentiment to improve, hiring needs to remain healthy, wage growth needs to moderate, and services activity needs to expand at a good pace, considering that this is the most important segment for the economy.
| Change in | Longs | Shorts | OI |
| Daily | -2% | -2% | -2% |
| Weekly | -4% | -6% | -5% |
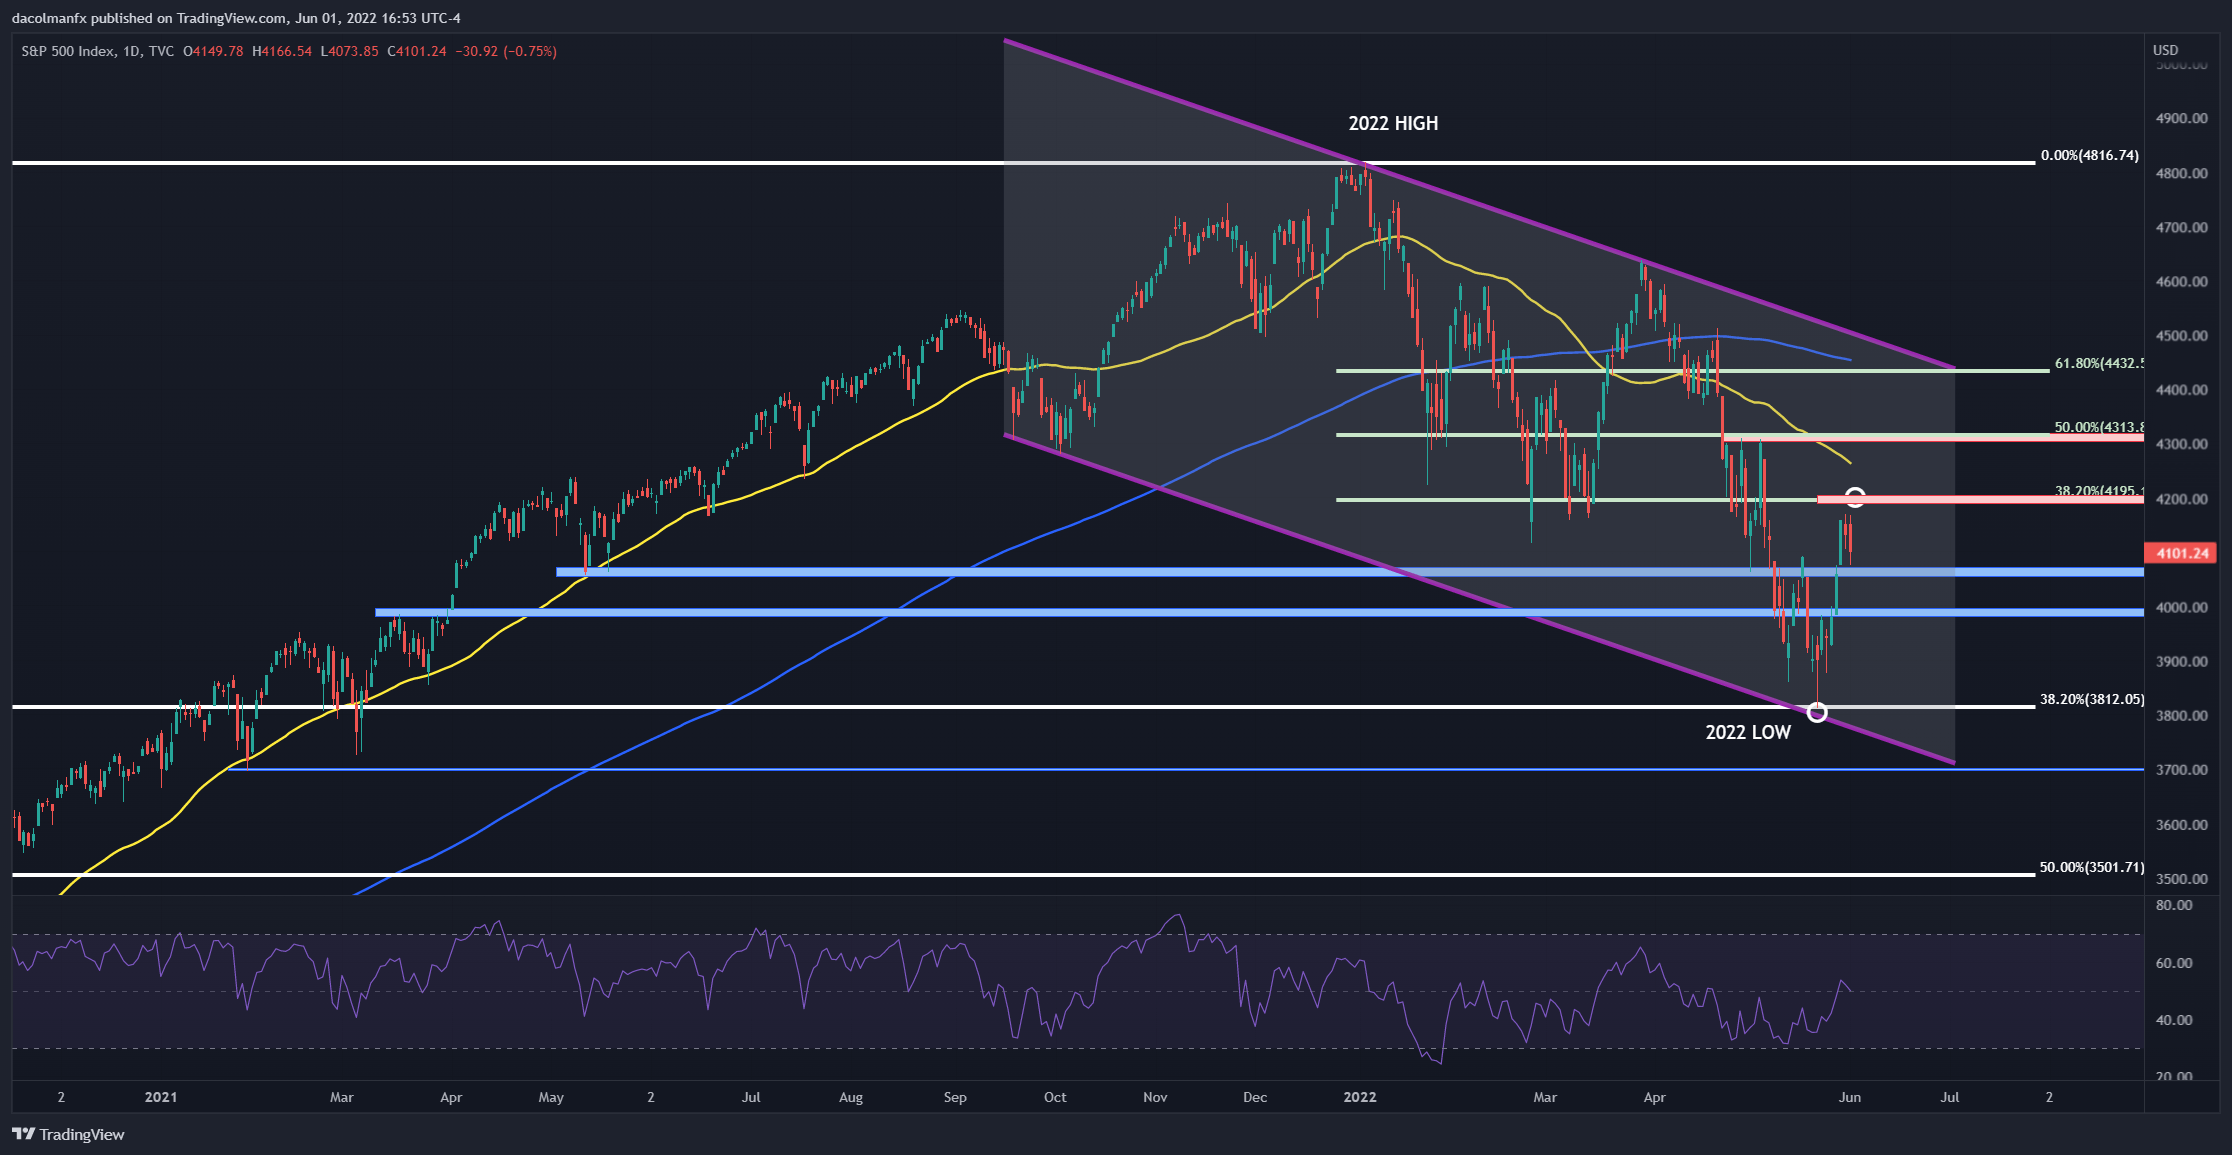
S&P 500 TECHNICAL CHART
After rebounding more than 7% from last week’s low and averting closing in a bear market, the S&P 500 has struggled to maintain bullish momentum, falling for the last two sessions on Wednesday, a sign that the recent upswing could still be a dead-cat bounce. We shall find out in the coming days, but if the index manages to hold above support at 4,070/4,050, bulls could become emboldened to jump back in, paving the way for a move towards Fibonacci resistance at 4,195, corresponding to the 38.2% retracement of the 2022 sell-off.
On the flip side, if sellers maintain the upper hand and ultimately drive the price below 4,070/4,050, there could be room for a drop towards the psychological 4,000 level. On further weakness, the focus shifts lower to the 2022 lows near 3,810.
S&P 500 TECHNICAL CHART