


US STOCKS OUTLOOK:
- S&P 500, Dow, and Nasdaq 100 slump Wednesday as stocks sell off across the board
- Market sentiment sours after Target's quarterly earnings miss estimates due to rising cost pressures
- Investors fear that rising inflation will start to eat into Corporate America profit margins more aggressively in coming quarters
Trade Smarter - Sign up for the DailyFX Newsletter
Receive timely and compelling market commentary from the DailyFX team
Most Read: Crude Oil Price Forecast -Two Way Action Continues. What's Next?
If there was any expectation that investor morale would improve and selling would abate, all hopes died Wednesday after U.S. equities plunged into freefall and erased all gains since last Friday, underscoring a famous adage that stocks often take the stairs up and the elevator down during a bear market.
At the closing bell, the S&P 500 dived 4.04% to 3,923 amid broad-based weakness on Wall Street due to falling confidence in the economic outlook. The Dow Jones, for its part, sank 3.57 % to 31,490, ending a three-day winning streak. Last but not least, the Nasdaq 100 bore the brunt of the sell-off, cratering 5.06% to 11,928, weighed down by a brutal rout in the technology space, with Apple (AAPL), Microsoft (MSFT), Amazon (AMZN), and Tesla (TSLA) dropping 5.64%, 4.77%, 7.16% and 6.80%, respectively on the day.
Sentiment took a turn for the worse after Target (TGT), one of the nation’s largest retailers, released extremely disappointing financial results and issued a profit warning on account of higher costs for freight, transportation, and compensation. TGT reported adjusted earnings per share of $2.19 for the first quarter versus $3.06 expected, and proceeded to lower its 2022 full-year operating income to around 6% from 8% previously, sending its shares plunging about 25%.

While Target offered positive comments on the health of the U.S. consumer, investors still panicked, fearing that red-hot inflation will eventually catch up with Corporate America and begin to eat into their profit margins rapidly in the coming quarters. Faced with this dilemma, businesses that can’t absorb rising costs could begin to pass them on to the consumer through higher prices, reinforcing inflationary forces in the economy and the need to tighten monetary policy more aggressively to cool excess demand.
In any case, in light of recent developments, equity analysts may begin to downgrade earnings forecasts, creating further headwinds for risk assets and complicating their recovery. Although the S&P 500 is most exposed to the technology space, the problems plaguing large retailers are also present in other sectors, so there is no room for much optimism at this time. Looking ahead, the S&P 500 is likely to remain biased to the downside, undermined by growing fears that the U.S. economy is headed for a hard landing as the Federal Reserve presses ahead with hawkish measures to restore price stability.
From a technical analysis standpoint, the S&P 500 has not yet crossed the bear market threshold like the Nasdaq 100 did, but it could do so soon if it falls through the May low around 3,855. A drop below that key support, which would officially put the index down more than 20% from its January high, could further erode sentiment and trigger more panic selling, paving the way for a retest of the 3,725, the March 2021 low.
| Change in | Longs | Shorts | OI |
| Daily | -3% | -2% | -3% |
| Weekly | -5% | -6% | -6% |
S&P 500 TECHNICAL CHART
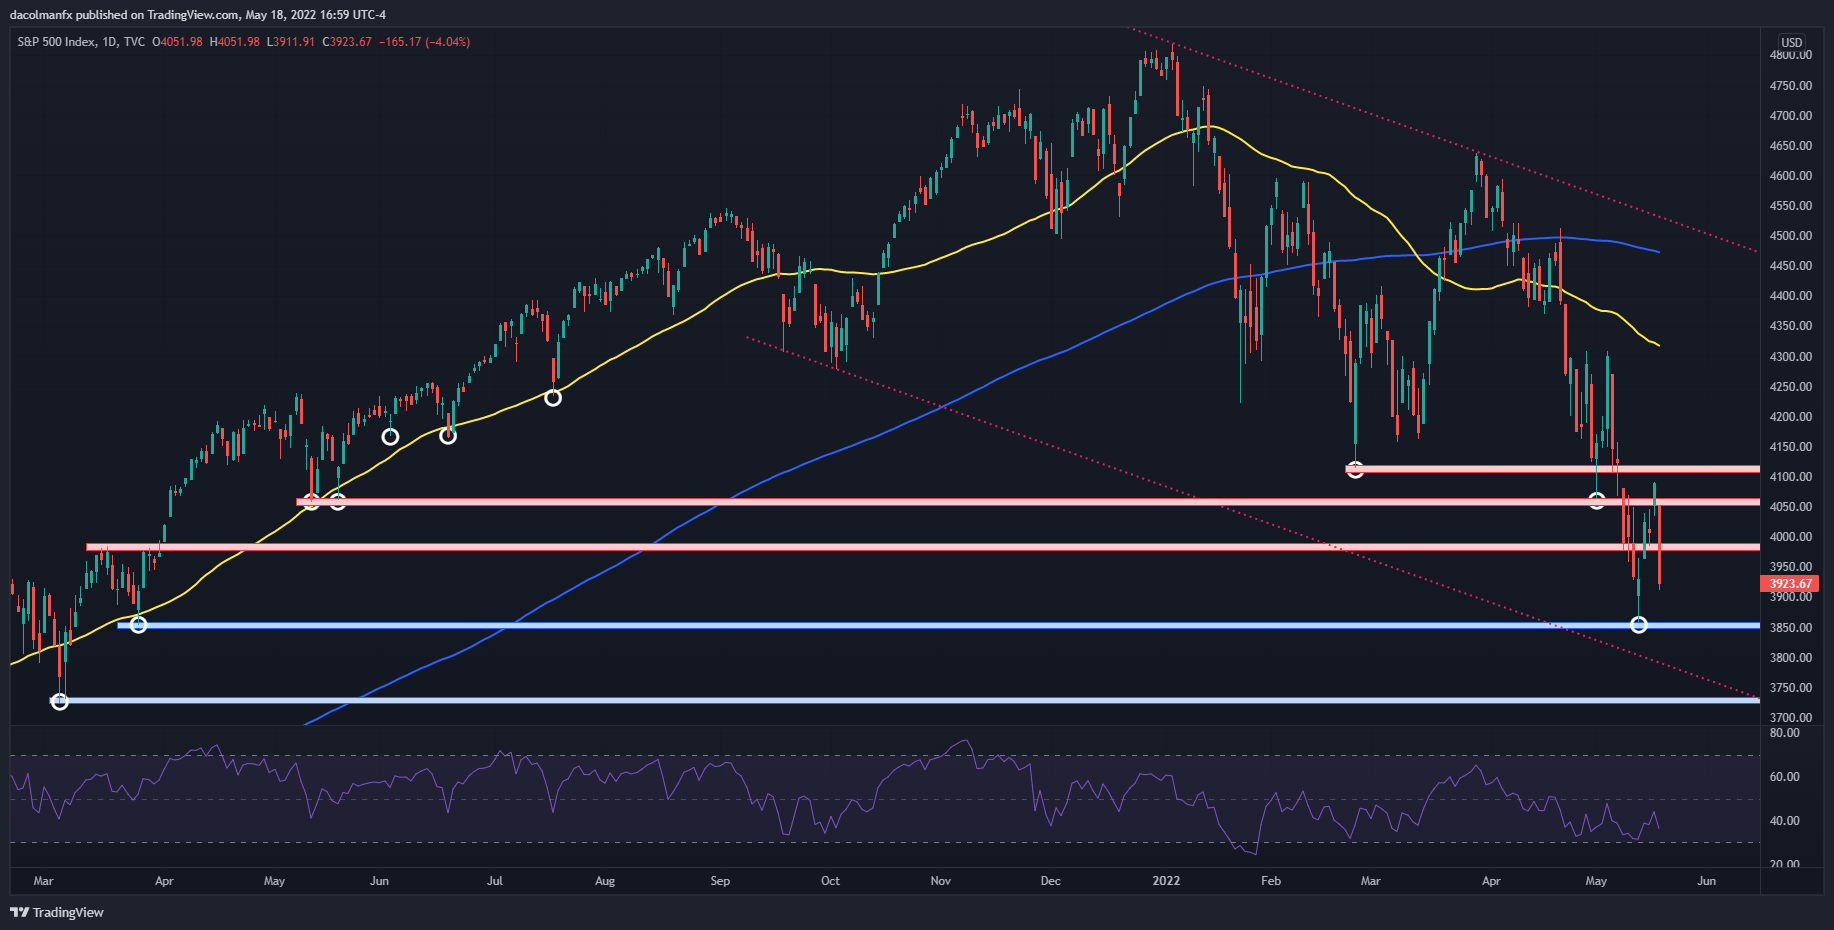
S&P 500 Technical Chart Prepared Using TradingView
EDUCATION TOOLS FOR TRADERS
- Are you just getting started? Download the beginners’ guide for FX traders
- Would you like to know more about your trading personality? Take the DailyFX quiz and find out
- IG's client positioning data provides valuable information on market sentiment. Get your free guide on how to use this powerful trading indicator here.
---Written by Diego Colman, Market Strategist for DailyFX


