


US STOCKS OUTLOOK:
- S&P 500, Nasdaq 100 and Dow Jones lose ground on Thursday, but finish the day well off their lows
- The S&P 500 comes a whisker away from entering bear market territory as Wall Street’s generals get taken out one by one
- With investor sentiment worsening, risk appetite is likely to remain depressed in the near term
Trade Smarter - Sign up for the DailyFX Newsletter
Receive timely and compelling market commentary from the DailyFX team
Most Read: Gold Prices Saddled by Higher Real Yields & Strong Dollar, Downside Breakout Eyed
U.S. stocks had another ugly day on Thursday, amid risk-off mood and capitulation on Wall Street. After moving between small gains and losses in morning trading, the tug of war resolved to the downside, with all three major equity averages registering their weakest close for the year.
When it was all said and done, the S&P 500 declined 0.13% to 3,930, recovering from a 1.8% drop that had the index flirting with bear market, a period of prolonged declines in which an asset has fallen 20% or more from a recent high. Although a bear market does not in itself predict future returns, it can certainly increase investor pessimism and further reduce risk appetite, especially if the condition afflicts the world’s most important benchmark.
The Nasdaq 100, after erasing a drop of more than 2%, was down 0.18% to 11,945. During the session, U.S. yields sank across the curve, boosting Treasury prices, but the technology sector was unable to benefit as the move was tied to safe-haven demand amid growing fears that the U.S. economy is headed for a hard landing.
No stock has been immune to the broad-based selling pressure of late, not even Wall Street's top generals, which are often considered safer bets. For example, Apple, Microsoft, and Alphabet have plunged 22%, 24% and 25%, respectively, from their 2022 highs. Amazon, another tech darling, has fared the worst, plummeting nearly 37% from its yearly high. With mega-caps shares breaking down and piercing one technical support after another, the S&P 500 and Nasdaq 100 will remain skewed lower in the near term.
As for the catalysts, the drivers remain the same: stagflation and Fed jitters. Traders are increasingly convinced that the inflationary environment will require a more forceful policy response, which may lead to a recession, a dreadful scenario for the U.S. consumer and, of course, for corporate earnings. Whether the excessive pessimism is justified is irrelevant, what matters now is that traders are convinced that trouble is coming and are acting on that belief by buying downside protection and shying away from stocks.
With no relevant U.S. economic data or key Fedspeak for the next couple of days, sentiment will remain fragile, preventing any meaningful rebound in risk-assets. Against this backdrop, the S&P 500 and Nasdaq 100 may extend losses heading into next week.

Earlier in this article, we discussed the possibility of the S&P 500 entering bear market territory. For the 20% decline condition to be met, the index will need to break below the 3,855 area. By looking at the daily chart below, we can see why this is problematic: just around those levels, we have a key technical support corresponding to the March 25, 2020 swing low. If this floor were to be taken out, sellers could accelerate the move lower, with the next notable barrier at 3,800, followed by 3,725.
On the flip side, if dip buyers return to take advantage of the oversold condition and spark a bullish reversal, the first resistance to take into consideration comes in at 3,980, and 4,060 thereafter.
S&P 500 TECHNICAL CHART
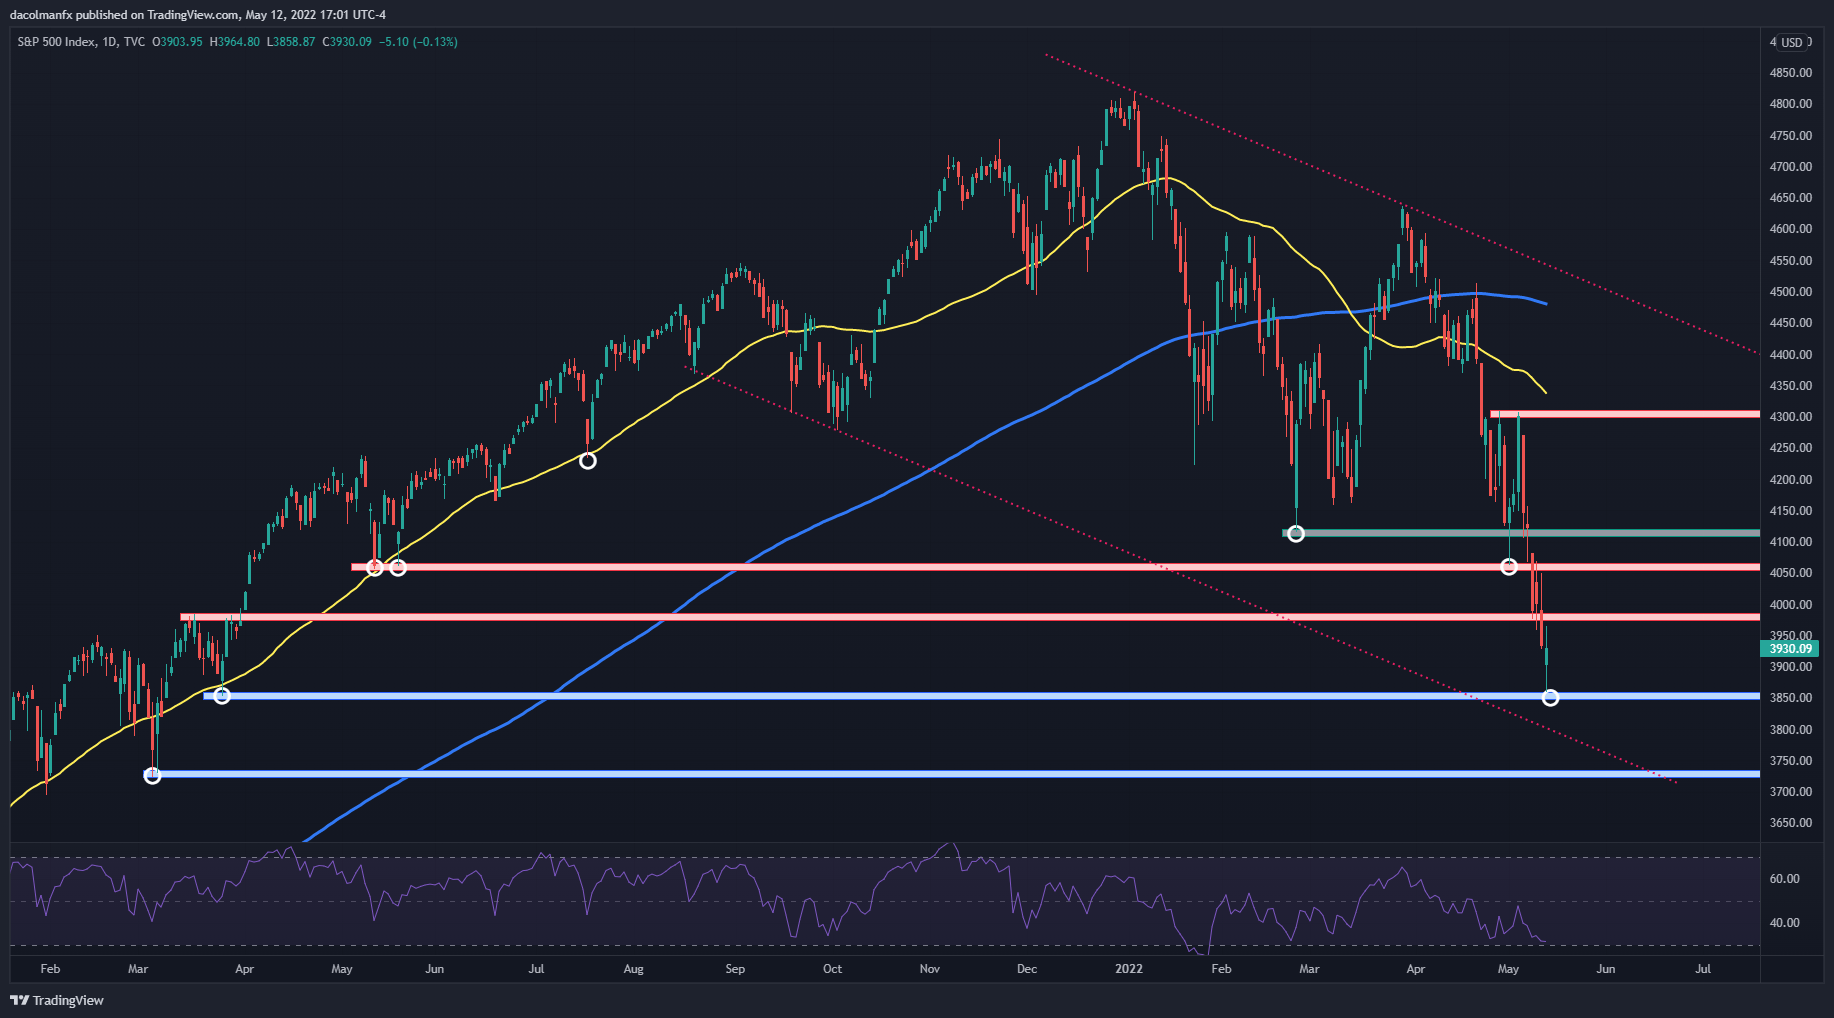
S&P 500 Technical Chart Prepared Using TradingView
EDUCATION TOOLS FOR TRADERS
- Are you just getting started? Download the beginners’ guide for FX traders
- Would you like to know more about your trading personality? Take the DailyFX quiz and find out
- IG's client positioning data provides valuable information on market sentiment. Get your free guide on how to use this powerful trading indicator here.
---Written by Diego Colman, Market Strategist for DailyFX


