


S&P 500, Dow Jones, DAX 30, Technical Analysis, Retail Trader Positioning - Talking Points
- Retail traders are increasingly betting up key global benchmark stock indices
- IG Client Sentiment is warning that the S&P 500, Dow Jones, DAX 40 may fall
- What are key technical levels to watch for in the event prices breakdown more?

Retail traders are increasingly betting the equities may rally in the near term, according to IG Client Sentiment (IGCS). Upside exposure is on the rise in the S&P 500, Dow Jones and the DAX 40. At times, IGCS can work as a contrarian indicator. If this dynamic continues, then these benchmark stock indices risk succumbing to additional selling pressure.
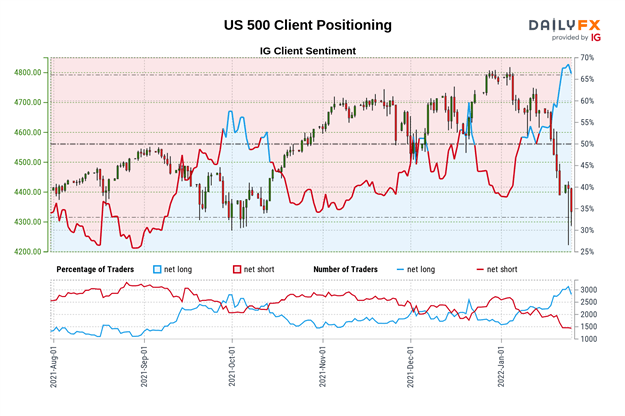
S&P 500 Sentiment Outlook - Bearish
The IGCS gauge shows that about 69% of retail traders are net-long the S&P 500. Since most investors are now net-long, this hints prices may continue falling. Upside exposure has increased by 6.72% and 9.57% compared to yesterday and last week respectively. With that in mind, the combination of current and recent shifts in positioning are offering a bearish contrarian trading bias for the S&P 500.
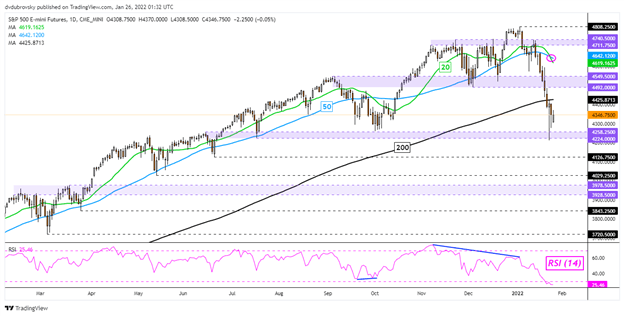
S&P 500 Futures Daily Chart
S&P 500 futures may be increasingly at risk of extending losses. A bearish crossover between the 20- and 50-day Simple Moving Averages (SMAs) emerged recently. Prices have also confirmed a breakout under the long-term 200-day SMA. Immediate support appears to be the 4224 – 4258 inflection zone. Falling under exposes the June low at 4126 before facing the May swing low at 4029. In the event of a turn higher, keep a close eye on the near-term SMAs for key resistance points.

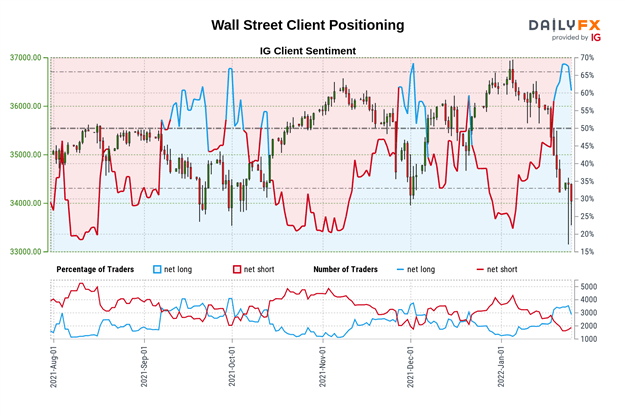
Dow Jones Sentiment Outlook - Bearish
The IGCS gauge shows that about 62% of retail traders are net-long the Dow Jones. Since the majority of traders are now net-long, this hints prices may continue falling. Upside exposure has increased by 0.66% and 9.50% compared to yesterday and last week respectively. With that in mind, the combination of current and recent shifts in positioning are offering a bearish contrarian trading bias for the Dow Jones.
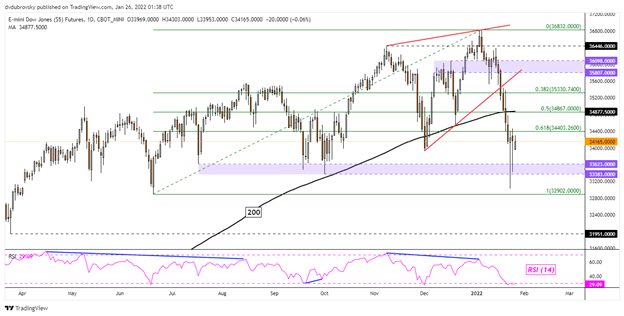
Dow Jones Futures Daily Chart
Dow Jones futures have extended losses after breaking under a bearish Rising Wedge chart formation. Prices have also confirmed a drop through the 200-day SMA, opening the door to a bearish technical bias. Immediate support appears to be the 33383 – 33623 inflection zone before facing the June low at 32902. Falling under the latter exposes the late March 2021 low at 31951. Pushing back above the 200-day SMA may open the door to testing the 38.2% Fibonacci retracement at 35330.
Introduction to Technical Analysis
Learn Technical Analysis
Recommended by Daniel Dubrovsky
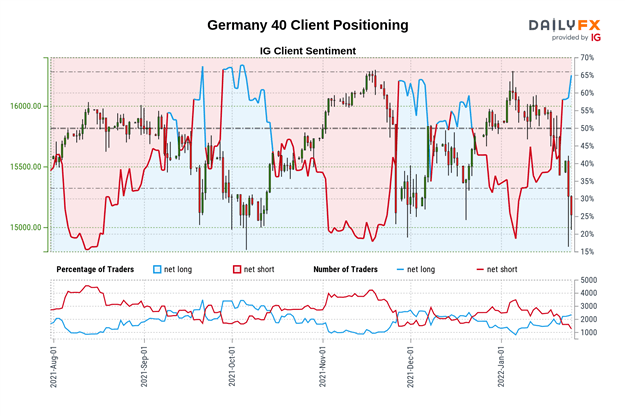
DAX 40 Sentiment Outlook - Bearish
The IGCS gauge shows that about 66% of retail traders are net-long the DAX 40. Since the majority of traders are net-long, this suggests prices may continue falling. This is as upside exposure increased by 2.35% and 19.59% compared to yesterday and last week respectively. With that in mind, the combination of overall and recent changes in positioning are offering a bearish-contrarian trading bias for the DAX 40.
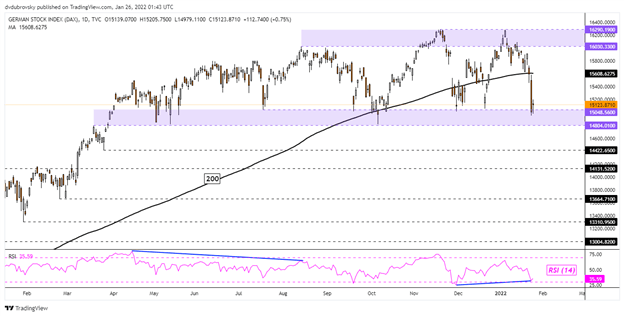
DAX 40 Daily Chart
Following recent losses, the DAX 40 finds itself sitting on the edge of the familiar 14804 – 15048 inflection zone that has its beginnings from March 2021. Breaking under this floor may open the door to extending losses towards the late March low at 14422 before facing the 14131 inflection point. Still, positive RSI divergence does show that downside momentum is fading. That can at times precede a turn higher. Reversing to the upside would place the focus on the 16030 – 16265 resistance zone.
*IG Client Sentiment Charts and Positioning Data Used from January 25th Report
--- Written by Daniel Dubrovsky, Strategist for DailyFX.com
To contact Daniel, use the comments section below or @ddubrovskyFX on Twitter


