


GOLD, XAU/USD, US DOLLAR, BREAKEVENS, INFLATION, YIELDS - Talking Points
- Gold rally faded as the market lacked momentum to push on
- Inflation and yields appear to be at a stalemate for gold over 2021
- The impacts of Covid-19 continue but what does it mean for XAU/USD?

Gold forecasts have been weighing conflicting underlying fundamentals for some time and this may have contributed to what is shaping up to be the first negative annual return for the yellow metal since 2018.
While inflation is perceived by some to underpin gold prices, this has not been the case in 2021. Price increases using any number of gauges are at multi-generational highs.
Market priced inflation at the benchmark 10-year part of the Treasury yield curve shows an increase over the year of about 55 basis points to be near 2.58%.
At the same time, nominal yields have only mildly outpaced inflation with a rise of around 60 basis points, currently yielding 1.55%. While real yields are still negative, a higher nominal interest rate environment might be undermining the precious metal.
As these dynamics have been playing out with wild swings in yield, Covid-19 has also been creating enormous disruptions across the globe.
The human and economic destruction of the virus against the unprecedented response from central banks and governments has seen market sentiment and volatility shift with the sands.
The safe haven status of gold might not have led to higher prices this year, but in the bigger picture, it is only in 2020 and 2021 that it has ever traded at loftier levels.
Trading Strategies and Risk Management
Bollinger Bands®
Recommended by Daniel McCarthy
GOLD TECHNICAL ANALYSIS
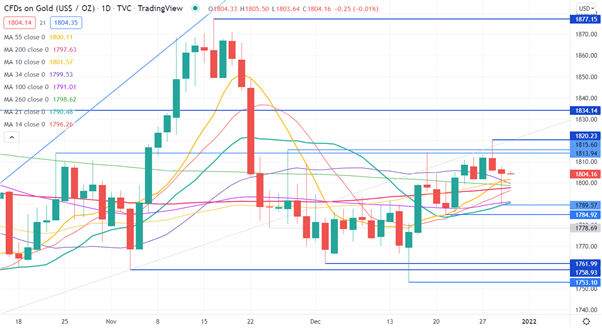
The holidays appear to have started early for the gold market as the price continues to move sideways. It tried make a break higher earlier this week but quickly retreated back inside the range and had a shot at breaking lower. But that failed as well.
The lack of direction and hesitancy is illustrated by the clustering of all short, medium and long term daily simple moving averages (SMA).
The 10, 14, 21, 34, 55, 100, 200 and 260-day SMAs all lie just below the current price, between 1790.48 and 1801.57.
Yesterdays’ sell off sliced down through all of these SMAs and then rallied back up through them again.
Technically, this implies that all the buy and sell orders have been filled that are related to these SMAs. New orders might be re-loaded, but it is possible that there could be less liquidity on another move lower, potentially further exasperating holiday market conditions.
Downside support could be at the pivot points and previous lows of 1789.57, 1784.92,
1761.99, 1758.93 and 1753.10.
On the topside, resistance might at the pivot points and previous high of 1813.94, 1815.60, 1820.23, 1834.14 and 1877.15
--- Written by Daniel McCarthy, Strategist for DailyFX.com
To contact Daniel, use the comments section below or @DanMcCathyFX on Twitter


