


Bitcoin, Ethereum, US Dollar, BTC/USD, ETH/USD – TALKING POINTS
- BTC/USD retesting multi-month highs after breaking key resistance range
- ETH/USD at one-year high after climbing above multi-month resistance
- What has been behind Bitcoin, Ethereum’s rally and how might it end?
Bitcoin Price Chart
BTC/USD has surged over 12 percent in one-day, the largest rise in a 24-hpur period since March 19. Bitcoin prices traded sideways for a little over a month after breaking below the mid-March uptrend. The cryptocurrency is now trading above two key technical swing-highs at 10540.49 and 10953.00, which if met with follow-through could inspire additional buyers to enter the market.
BTC/USD – Daily Chart
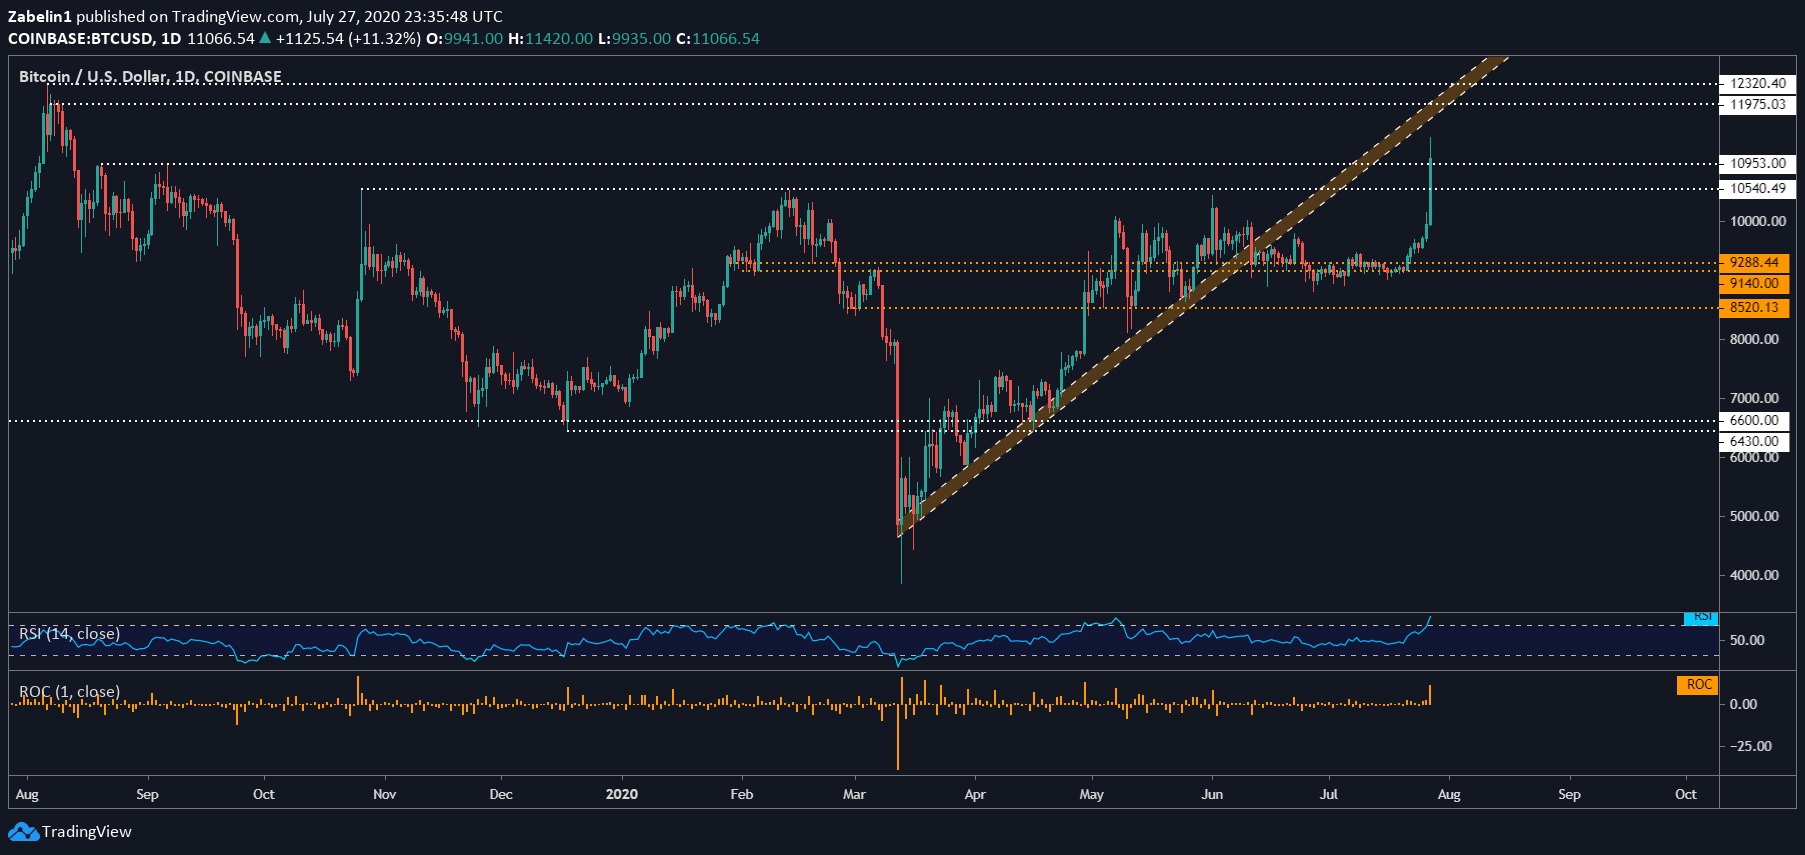
BTC/USD chart created using TradingView
Beyond this range lies another formidable two-tiered resistance range marked by the 11975.03-12320.40 parameters. Friction at the lower bound could cause BTC/USD to retreat to 10953.00. If it is able to proverbially tread water above this level without sinking, it could reinforce the bullish narrative – at least in the short term.
Ethereum Forecast
Ethereum, much like Bitcoin, has also experienced a significant jump and breach of key technical levels. ETH/USD’s wick stopped just short of the first tier of the July 2019 swing-high range between 334.86 and 364.49. Clearing the former with follow-through could invite a challenge to break the latter. In this scenario, a resurgent bullish outlook could further amplify ETH/USD’s gains.
ETH/USD – Daily Chart

ETH/USD chart created using TradingView
Bitcoin and Ethereum’s rise could be attributed to two factors that may have to remain constant in order to extend their respective gains. The first – which complements the second – is an environment where investors feel comfortable enough diverting capital into relatively illiquid and volatile assets. The second is weak demand for havens like the US Dollar which could further amplify BTC/USD’s and ETH/USD’s gains.
--- Written by Dimitri Zabelin, Currency Analyst for DailyFX.com
To contact Dimitri, use the comments section below or @ZabelinDimitri Twitter


