


US Recession Watch Overview:
- Ongoing stimulus efforts by the Federal Reserve to head off the economic fallout from the coronavirus pandemic have implicitly tamped down the US Treasury yield curve.
- There remains a significant expectations gap what the yield curve pricing for a recession and other measures of near-term growth; the Q2’20 Atlanta Fed GDPNow reading is, simply put, awful.
- Traders continue to anticipate no change in interest rates by the Federal Reserve through January 2021 – that means no move into negative interest rate territory.

US Q2’20 GDP Downturn Will Be Severe…
The US economy is in rough shape. Thanks to how GDP is calculated (the first month of the quarter has five times the weight as the third month), the economic brunt of the coronavirus pandemic, levied significantly in April and then trailing off in May, will show up in the form of a significantly depressed growth reading.
The Atlanta Fed GDPNow growth tracker for Q2’20 US GDP has flirted with a contraction in the neighborhood of -50% (more on that below). The nine-week total for US initial jobless claims is now a staggering 38.6 million.
And yet, despite the US Treasury yield curve signalling less than a 20% chance of a recession within the next 12-months, it’s obvious that fears of a major economic contraction are well-founded. [We’ll explore why the US Treasury yield curve is no longer a viable indicator in this regard towards the end of this note.]
…but US Q3’20 GDP May Offer ‘Green Shoots’?
Even as the US economy deals with the worst rate of contraction not just since The Great Recession, but the fastest contraction in the post-World War II era – yes, going back to The Great Depression – there are some signs that things may not be as ‘bad as feared.’ The labor market would be in worse shape but for the quizzically strong May US nonfarm payrolls report. Initial jobless claims, while still high by historical standards, continue to ease.
The Citi Economic Surprise Index for the United States, a time-decay gauge of economic data momentum, hit an all-time high of 126.70 on Thursday, June 18. Objectively speaking, economic data has been coming in much better than anticipated. These ‘green shoots,’ however, are all about perspective.
Atlanta Fed GDPNow Q2’20 US GDP Estimate (June 18, 2020) (Chart 1)
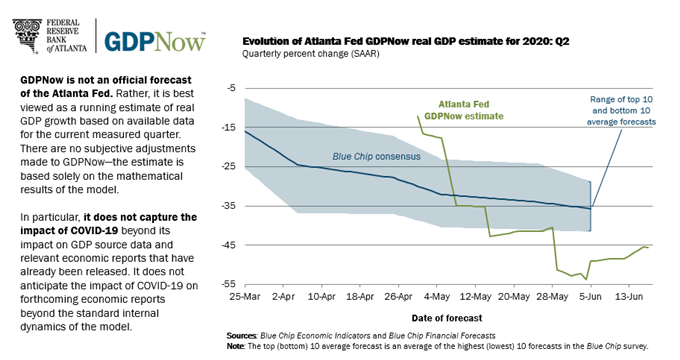
The perspective is that, because the situation had become so bleak, analysts are still re-calibrating their expectations to reality. The unfortunate reality is that the Atlanta Fed GDPNow Q2’20 growth forecast remains depressing at best, despite US economic data momentum appearing to be at its strongest level ever: this bullish momentum has only carried the Q2’20 growth forecast from -54.3 to -45.5%. Banks and economic forecasting institutes continue to predict that Q2’20 will be produce an annualized GDP in the neighborhood of -35% to -50%.
Fed Tinkering at the Edges
The Federal Reserve has done everything that they intend on doing on the interest rate front, given recent commentary from various Fed policymakers, including Fed Chair Jerome Powell. The Fed’s various liquidity facilities have seen the Fed balance sheet balloon north of $7 trillion, easily surpassing the heights seen during The Great Recession. The pace at which the Fed adds liquidity to the market will be the most important facet moving forward, particularly in the wake of the June Fed meeting whereby officials signalled their intent to keep rates at their current levels – but not into negative territory – through 2022.
Federal Reserve Interest Rate Expectations (June 18, 2020) (Table 1)
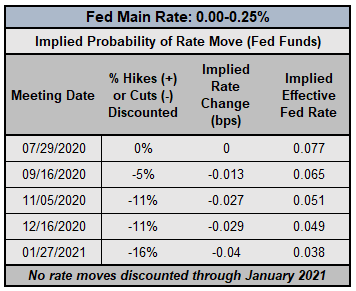
As a result, market participants are firm in their belief that we’ve reached the lower bound for the time being. To this end, any suggestions by rates markets that a rate hike is coming anytime soon is a pricing quirk to be ignored.
Yet with that said, that doesn’t mean there aren’t other options besides negative interest rates: an extended forward guidance; yield curve control (which is basically in effect by issuing such long-dated forward guidance); or even nominal GDP targeting. There remain quite a few tools left in the Fed’s tool kit before the market may need to consider before seriously pricing in the prospect of negative interest rates from the Fed.
Using the US Yield Curve to Predict Recessions
The US Treasury yield curve remains normalized – long-end yields are higher than short-end yields – but that’s not an accurate reflection of the state of the US economy. Historically, the relatively faster rise by long-end yields compared to short-end yields occurs during times of expected economic expansion, so traders may be prone to interpret the yield curve movements as a sign that market participants believe that the worst period of uncertainty around the coronavirus pandemic is over. Accordingly, with the recent performance of US equity markets, financial markets have evidently made up their mind in the short-term (we’ll see how long that lasts).
US Treasury Yield Curve: 1-month to 30-years (June 18, 2020) (Chart 2)

The Fed’s efforts to flood the market with liquidity have depressed short-end yields, leading to an artificial steepening of the US yield curve. However, in somewhat of an encouraging sign, even as long-end yields remain significantly depressed from where they stood a year ago, they have continued to climb over the past month, if only modestly.
A Refresher: Why Does the US Yield Curve Matter?
Market participants use yield curves to gauge the relationship between risk and time for debt at various maturities. Yield curves can be constructed using any debt, be it AA-rated corporate bonds, German Bunds, or US Treasuries.
A “normal” yield curve is one in which shorter-term debt instruments have a lower yield than longer-term debt instruments. Why though? Put simply, it’s more difficult to predict events the further out into the future you go; investors need to be compensated for this additional risk with higher yields. This relationship produces a positive sloping yield curve.
When looking at a government bond yield curve (like Bunds or Treasuries), various assessments about the state of the economy can be made at any point in time. Are short-end rates rising rapidly? This could mean that the Fed is signaling a rate hike is coming soon. Or, that there are funding concerns for the federal government. Have long-end rates dropped sharply? This could mean that growth expectations are falling. Or, it could mean that sovereign credit risk is receding. Context obviously matters.
US Treasury Yield Curves: 3m10s and 2s10s (1975 to 2020) (Chart 3)
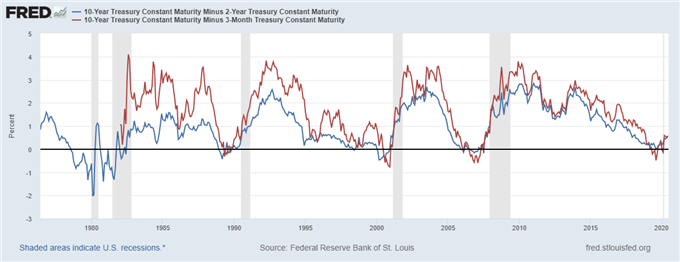
There is an academic basis for yield curve analysis. In 1986, Duke University finance professor Campbell Harvey wrote his dissertation exploring the concept of using the yield curve to forecast recessions. Professor Campbell’s research noted that the US yield curve needs to invert in the 3m10s for at least one full quarter (or three months) in order to give a true predictive signal (since the 1960s, a full quarter of inversion has predicted every recession correctly).
NY Fed Recession Probability Indicator (June 5, 2020) (Chart 4)
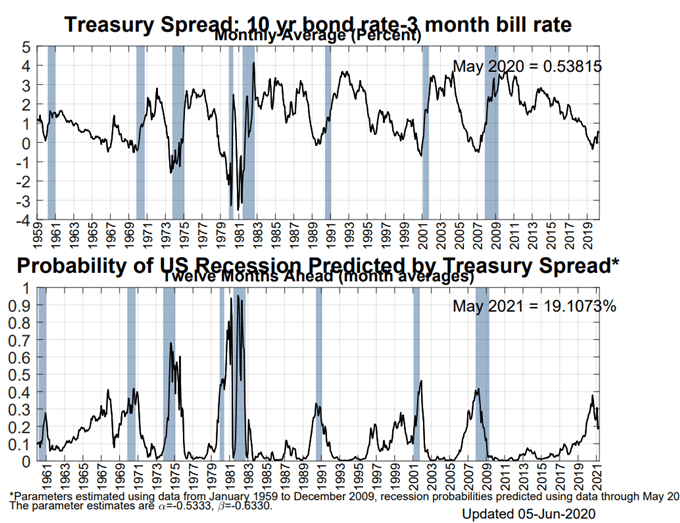
It still holds that, due to the Fed’s extraordinary efforts to flood the market with liquidity, US recession odds remain artificially low as measured by the relationship among US Treasury spreads. These efforts by the Fed have allowed the US yield curve to normalize, removing the inverted kink that would otherwise suggest rising recession odds. To this end, there is currently a 19.2% chance of a US recession in the next 12-months, per the NY Fed Recession Probability Indicator; a likelihood we deem to be far, far too low given the abysmal readings set forth by the Atlanta Fed GDPNow Q2’20 growth tracker.
Conclusions about the US Yield Curve and US Recession Odds
Nothing has changed, particularly as concerns of a second wave* emerge (*the US never beat its first wave, so it’s a misnomer to say that this is the second wave; nevertheless…). The coronavirus pandemic is an economic crisis unseen in nearly any of our lifetimes (very few people today were alive during the 1918 Spanish flu), so it’s difficult to properly measure the severity of this crisis given the fact that we don’t have any experiential memory to build upon (episodic memories seem to have been ignored).
But the simple truths are that we’ve seen the sharpest drop in US growth expectations and the fastest collapse in the US labor market, ever. We can say with a high degree of confidence that the US economy is entering a recession (depression?) in the very near-term, regardless of what the Fed-controlled US Treasury yield curve is otherwise suggesting.
--- Written by Christopher Vecchio, CFA, Senior Currency Strategist


