


FTSE 100, S&P 500, Trader Positioning - Talking Points
- FTSE 100 and S&P 500 recently rejected resistance
- Will this inspire retail investors to curb selling bets?
- FTSE 100, S&P 500 IGCS outlook pointing bearish
What Does Trader Positioning Say About the FTSE 100 and S&P 500
Upside momentum in global benchmark stock indexes – such as the FTSE 100 and S&P 500 – continues to dwindle. Thus far, it seems to have also struggled to materially curb traders’ tendency to sell into recent dynamics. A potential bearish signal in equities could make itself more prevalent if investors further diminish their scope to sell into incoming price action. In addition to this, I also discussed the outlook for AUD/JPY, NZD/JPY and EUR/JPY in the recording above.
FTSE 100 Sentiment Outlook
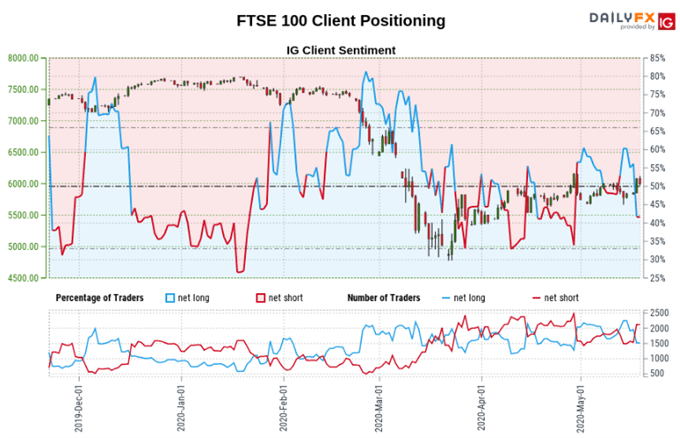
The IG Client Sentiment (IGCS) gauge implies that 48.03% of retail traders are net long the FTSE 100. Relative to the S&P 500, the UK benchmark stock index has experienced more range-bound price action since late March. In this dynamic, what tends to occur is investors selling at highs while buying at lows. Indeed, on the IGCS FTSE 100 chart below, you can see swings in positioning as prices consolidate.
Net long positioning is up 14.83% and 7.55% from yesterday and last week respectively. Meanwhile net short bets are down 10.58% and 21.73% over the same period respectively. Recent changes in sentiment warn that the current FTSE 100 price trend may soon reverse lower despite the fact traders remain netshort.
FTSE 100 Technical Analysis
The FTSE 100 appeared to have topped after prices turned just shy of 6169, key resistance that has its beginnings from early March. That has placed the focus on the 5861 – 5955 inflection point which if taken out, exposes support at 5709. Otherwise, a turn higher has resistance in focus at 6443 – 6533.

FTSE 100 4-Hour Chart

FTSE 100 Chart Created in Trading View
S&P 500 Sentiment Outlook
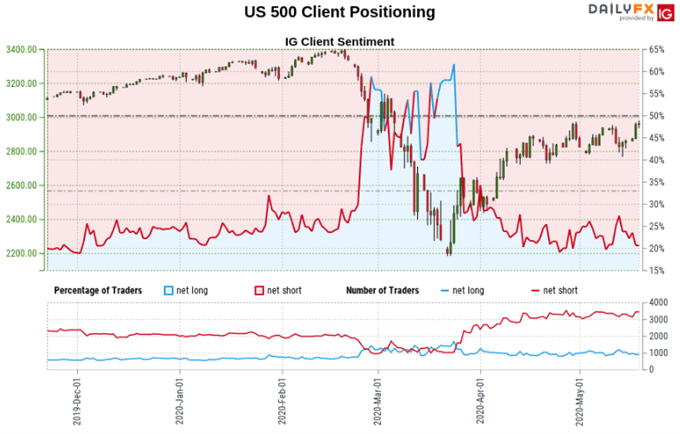
The IGCS gauge implies that 24.24% of retail investors are net long the S&P 500. Those betting on the upside have increased 11.20% and 1.85% over a daily and weekly period restively. Recent changes in sentiment warn that the current price trend may soon reverse lower despite the fact traders remain netshort. That could speak to a greater share of traders attempting to pick a future bottom in the index.
Develop the discipline and objectivity you need to improve your approach to trading consistently
S&P 500 Technical Analysis
S&P 500 futures have rejected the critical resistance range between 2944 – 2965 which has been holding since late April. Recently, prices declined through a near term rising support line from May 14 and seem to be struggling to find follow-through. Still, a turn lower here places the focus on key support which seems to be a range between 2755 – 2771. Uptrend resumption exposes peaks from early March.
S&P 500 Futures 4-Hour Chart
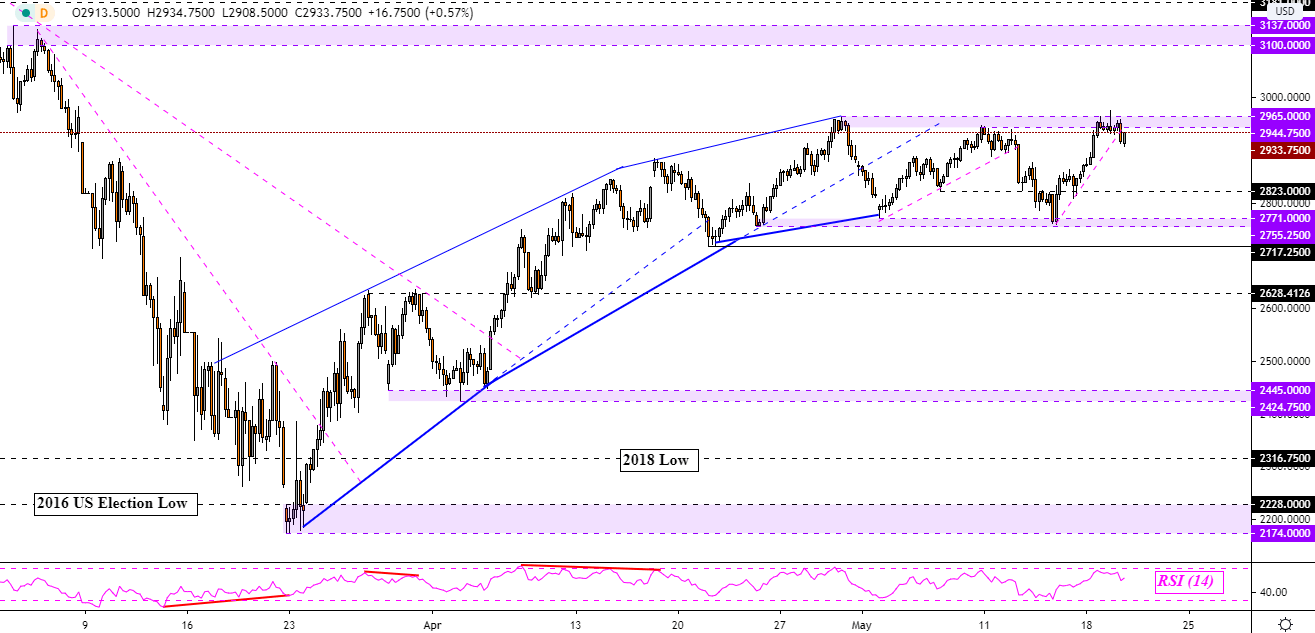
S&P 500 Futures Chart Created in Trading View
*IG Client Sentiment Charts and Positioning Data Used from May 20 Report
--- Written by Daniel Dubrovsky, Currency Analyst for DailyFX.com
To contact Daniel, use the comments section below or @ddubrovskyFX on Twitter


