


S&P 500 Talking Points:
- The S&P 500 has led its fellow indices to the biggest single-week collapse since the 2008 financial crisis
- Expectations for central banks to step in to temper the panic are shooting higher, but central banks may be tapped
- Fiscal policy is one of the last bastions of ‘dry powder’ and the White House may find the motivation in President Trump’s reelection campaign
The markets are under severe pressure this past week with the US equity market taking the charge in one of the worst slumps since the Great Financial Crisis (GFC) back in 2008. The comparison is an apt one but also unfamiliar for many. Given how long ago the last official bear market took place, the full scope of the threat that we face may not resonate with many young investors. That has perhaps been somewhat evident in the reluctance in the past years to commit to a full deleveraging. The closest we cam was the 4Q 2018 tumble which barely missed the technical definition of a ‘bear market’ which is a 20 percent drop from peaks. We have already flipped from record high to technical ‘correction’ (10 percent drop) in the span of a week. Either the market will need to exhaust itself of external forces will need to step in with reassurance if there is reasonable expectation of a recovery.
The Possibility of Natural Exhaustion
Focusing on the S&P 500 for a representative of ‘the market’ the pain is palpable. Though we are down seven trading sessions, the five-day rate of change encompasses the impact sufficiently. In a weekly comparison, this is the biggest slump since the 2008 tumble through September/October of that year – height of the crisis. This move has reversed 14 months of gain single-handedly while taking out the 200-day moving average and trendline support of the past year with nary a blink.
Chart of S&P 500 with 5-Day Rate of Change (Daily)

Chart Created on Tradingview Platform
While the pace of decline is impressive, the consistency is itself worrisome. A seven consecutive day drop represents the remarkably timely reference to a similar trial of fear that prolific: the lead up to the 2016 presidential election. There are already parallels to that being drawn by President Trump himself. However, in such moves, there are natural ebbs and flows that occur in both mass psychology and the movement of money. Panic is a momentum built into deleveraging efforts to avoid more dramatic losses, but there is a segment of the market that will prove very resilient to short-term punishment and those that are interested in opportunistically entering at a point that they believe discounted against a backdrop where not much has changed. Should institutions (like the SNB), funds and other large bodies refuse to participate; the proportion of the market that is very responsive could settle enough to allow the opportunists to step back in. If that is the case, without further appetite for value, a pause would not bolster the case for a lasting recover well.
| Change in | Longs | Shorts | OI |
| Daily | 6% | -5% | 1% |
| Weekly | 7% | -10% | -2% |
Chart of S&P 500 and Consecutive Days Trends (Daily)
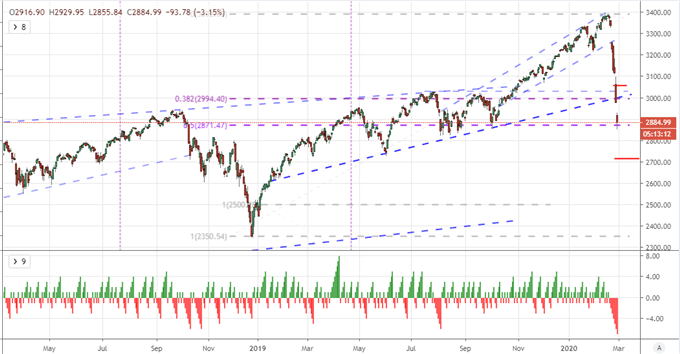
Chart Created on Tradingview Platform
The Federal Reserve and Other Central Banks
When traders are looking for a reason to jump back into the fray despite such uncertainty holding firm, one of the more often cited sources of confidence this past decade has been a reference to the major central bank. These deep-pocketed groups have been very active in dumping liquidity into the system through rate cuts (some into negative territory) and introducing unorthodox support like quantities easing and repo activities. The Federal Reserve reverted back to the dovish side of neutral this past year with three rate cuts, but stated it intended to hold fast in 2020. The markets seem not to believe they will be able to hold out. Below is the difference in the implied rate of the February and December Fed Funds futures contracts which indicates the amount of easing expected over the next 10 months. The market is fully pricing in 75 basis point (three standard cuts).
Chart of S&P 500 and Consecutive Days Trends (Daily)
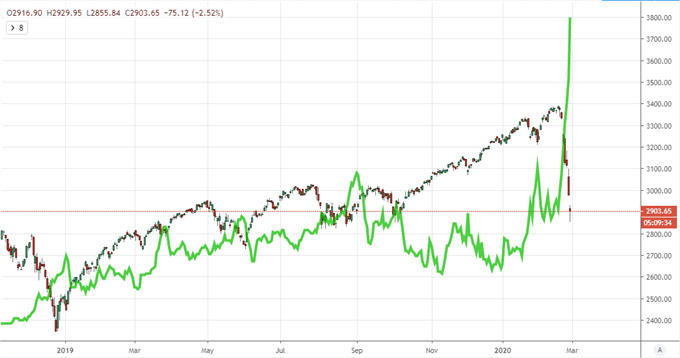
Chart Created on Tradingview Platform
One of the greatest risks in my view is that the markets raise the stakes of dependency on the Fed and other major central banks only to learn that these groups have run out of effective options. The US central bank can cut a little further, but it is very near zero. Its European and Japanese counterparts are already below the water line. More stimulus hasn’t been effective for the Fed this year as it has lifted its balance with short-duration purchases. If confidence falters here, a lot of the foundation of appetite built up these past years could fall away and inadvertently exacerbate issues.
Chart of S&P 500 and Aggregate Stimulus from Largest Central Banks (Monthly)
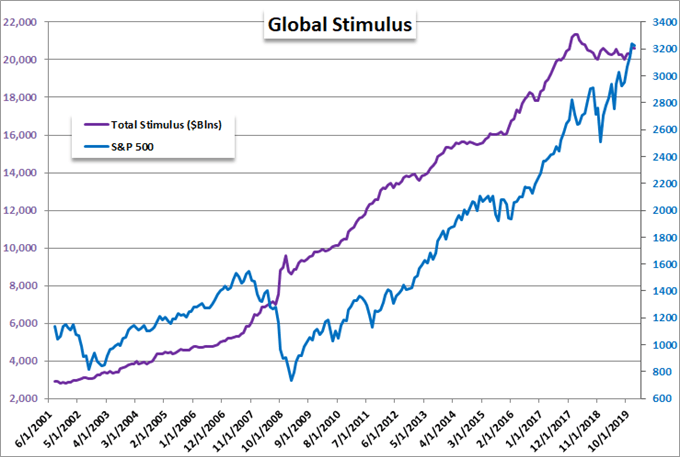
Chart made by John Kicklighter with Data from Bloomberg
Fiscal Stimulus To the Rescue?
Where the Federal Reserve and other monetary policy authorities are running short on coffers and effectiveness, the governments of the world still have the capacity to act. We have seen more than a few stimulus discussions across the globe and Japan even produced a sizable effort just a few months ago. Governments are not mandated to stabilize financial systems, but their interest in maintaining growth is clear. A problem is that in the past few years, policies have tended to defer to efforts that earn growth at the expense of trade (tariffs and such) which may benefit a specific economy but is a net negative for global growth on the balance. To respond to a global market slump, a collaborative effort would more likely be necessary and avoidance of further tariff-like efforts avoided at all costs.
Google Search for Stimulus
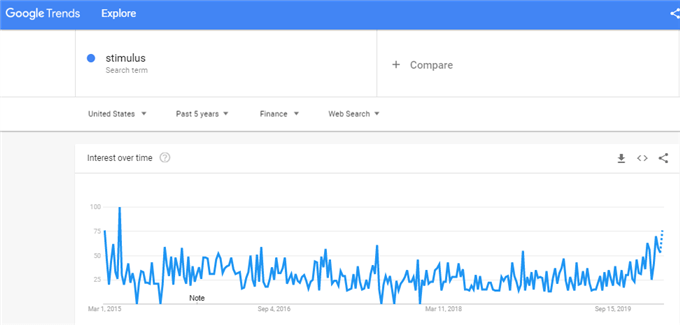
Chart from Google Trends
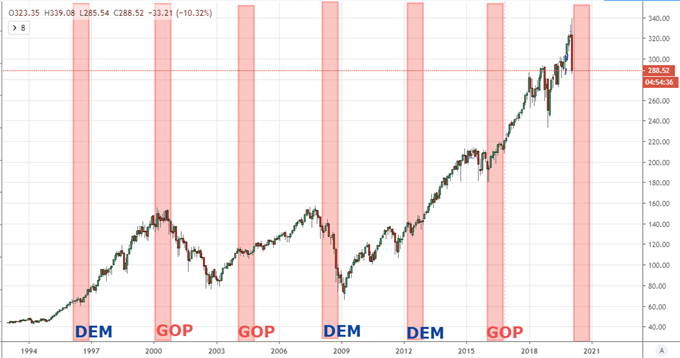
With the US heading into a President election cycle there is clear interest from the incumbent White House to maintain stability at all costs. It can be difficult to win election within your own party or re-election if you are up for a second term if the economy and financial system are under severe pressure. The Great Financial Crisis saw the switch from Republican to Democrat president and we were just starting to see the hints of the Tech Boom-Bust in 2000 when George Bush replaced Bill Clinton. President Trump will be mindful of this risk and his administration will more likely reach compromises where previously they could not be found to help the campaign.
Chart of S&P 500 and Election Year (Monthly)
Already, the President seems to show appreciation for the risk and an effort to calm the market panic as fearmongering, but that has not soothed the financial system as of yet. The longer the selling persists, the more likely it is emerging policy efforts will be fast tracked.
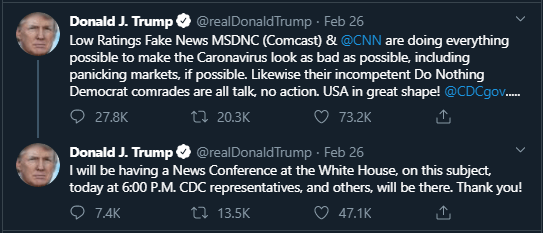
Tweet from Donald Trump’s Twitter Handle
If you want to download my Manic-Crisis calendar, you can find the updated file here.
.


