


AUD/USD, NZD/USD, RBA, RBNZ, S&P 500, Emerging Markets – Talking Points
- Australian Dollar, New Zealand Dollar have been falling as S&P 500 rose
- RBA and RBNZ rate cut bets have been rising, US Dollar has greater yield
- AUD/USD and NZD/USD upside breakouts still looking for confirmation
Australian Dollar, New Zealand Dollar Diverge with S&P 500, Emerging Markets
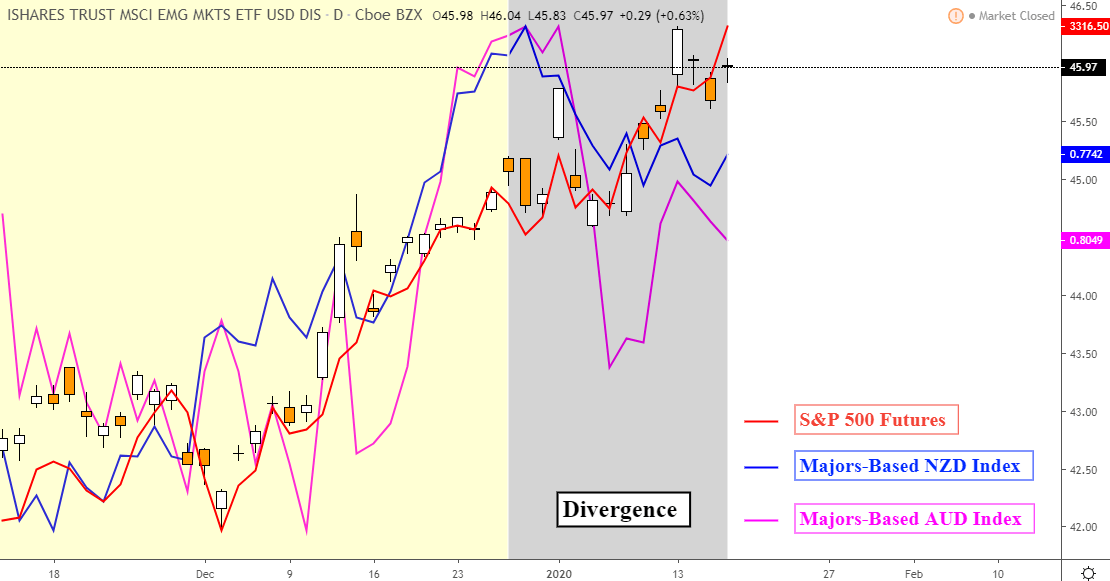
The “pro-risk” Australian Dollar and similarly-behaving New Zealand Dollar have generally been struggling to capitalize on aggressive gains in overall market sentiment as of late. Since the beginning of January, the S&P 500 and MSCI Emerging Markets Index (EEM) are up about 2.7% and 2.5% respectively. These gains partly reflected optimism into the US-China “phase one” trade deal signed on January 15.
On the chart below, I have overlaid S&P 500 futures and the EEM with a majors-based AUD and NZD index. The latter two are composed of an average of their performance against the most-liquid forex majors. These include the US Dollar, Euro, Japanese Yen and British Pound. Since the end of 2019, both the NZD and AUD have generally been weakening despite a clear improvement in market mood. What gives?
AUD, NZD, S&P 500 and Emerging Markets
RBA and RBNZ Rate Cut Bets Have Been on the Rise
Their lackluster performance could be traced down to what typically matters the most for driving currencies, their expected rate of return. Coinciding with declines in AUD/USD and NZD/USD have been weakening regional government bond yields (see chart below). The Australian 2-year yield is down over 15% since the beginning of 2020. This is as the New Zealand 2-year yield declined over 9%.
At the end of 2019, cash rate futures were pricing in about a 38.3% chance of a 25-bp rate cut from the Reserve Bank of Australia (RBA) in February. This has since increased to a 54.5% probability. Regarding the Reserve Bank of New Zealand (RBNZ), expectations of a 25-bp cut by June rose slightly from 30.1% to 36% during the same period. The latter may explain why AUD has been faring worse compared to NZD.

Australian, New Zealand Government Bond Yields, AUD/USD, NZD/USD

AUD and NZD May Struggle for Sentiment Follow-Through
These currencies no longer hold a return appeal over the US Dollar. Benchmark lending rates in Australia and New Zealand stand at 0.75% and 1.00% respectively, lower than the 1.50 – 1.75% range from the United States. This year the Fed has signaled that it intends to keep borrowing costs unchanged. The RBA has hinted at further easing “if needed” as the RBNZ sees rates being “low for some time”.
This opens the door for the Greenback to in some cases outperform against AUD and NZD during times of market optimism. Or at the vary least, undermine some of their potential gains. There was a mixed reaction from AUD/USD and NZD/USD around economic data that impacted sentiment. These included U.S. retail sales and a slew of Chinese data such as GDP and industrial production.
With that in mind, it seems as though the focus for the Aussie and Kiwi may be more tilted towards monetary policy. They have seen minimal gains in the immediate sense despite the US-China trade deal boosting sentiment. Demand for relatively-safer local bonds seems to be holding. Follow-through will have to wait until it can impact the trajectory of the RBA and RBNZ. Until then, the yield advantage goes to the US Dollar.

Australian Dollar Technical Analysis
On a weekly chart, AUD/USD has been slowly rising since bottoming in August 2019. Prices climbed above the falling trend line from December 2018, but follow-through has been lacking. Taking out highs from July 2019 may refocus the medium-term technical outlook to the upside. Resuming the dominant downtrend entails taking out the psychological barrier between 0.6670 – 0.6743.
AUD/USD Weekly Chart

New Zealand Dollar Technical Analysis
NZD/USD has also taken out a medium-term falling trend line on the weekly chart below. This falls in line with the near-term uptrend since late September. Taking out highs from July exposes peaks from 2019 which creates a range of resistance from 0.6896 to 0.6969. Resuming the previous downtrend entails taking out the key support range between 0.6203 – 0.6255.
NZD/USD Weekly Chart

--- Written by Daniel Dubrovsky, Currency Analyst for DailyFX.com
To contact Daniel, use the comments section below or @ddubrovskyFX on Twitter


