Canadian Dollar, GDP, USD/CAD, NZD/CAD - Talking Points
- Canadian Dollar showing signs of strength after prolonged depreciation
- The Loonie is at risk to softer-than-expected November Canadian GDP
- USD/CAD may reverse on technical signals as NZD/CAD uptrend holds


Canadian Dollar Eyeing November GDP Report
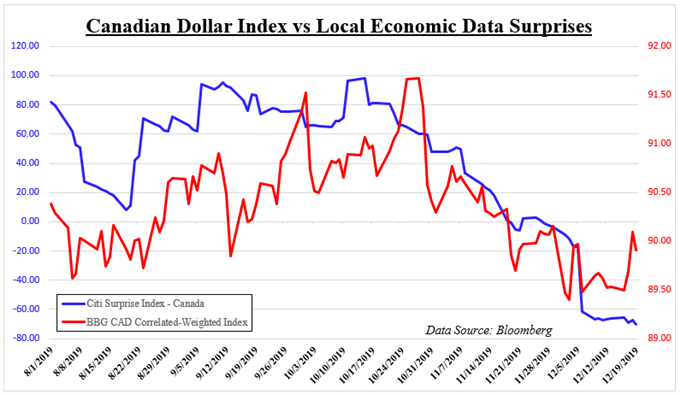
Using a correlated-weighted index, the Canadian Dollar has been showing some signs of strength lately after prolonged weakness since the end of October. Could this be a bottom? On the chart below, declines in CAD have been associated with increasingly disappointing local economic data outcomes relative to economists’ expectations. November’s dismal Canadian jobs report followed this trend.
This helped drive dovish expectations for the Bank of Canada (BoC), fueling bets that the BoC will eventually follow the easing seen across major and developed economies in 2019. This week’s Canadian inflation report helped to pour some cold water on those expectations however. Median core CPI unexpectedly clocked in at its highest since March 2009.
Dovish estimates remain cautious, with overnight index swaps pricing in about a 52.4 percent chance of a 25bp cut by the end of next year. BoC Governor Stephen Poloz undermined easing bets by focusing on the prominence of fiscal stimulus as the government looks to deliver on middle-class tax cuts. This is as the USMCA appears set to be passed into law early next year, fueling trade between the three neighbors.
With that in mind, the Canadian Dollar will be closely watching local GDP on December 23. The risk here for CAD is that the trend in softer-than-expected data rekindles dovish BoC forecasts. That could reverse some of the near-term gains seen in the Loonie which have also been coinciding with a rise in crude oil prices. The latter is a key revenue for the nation that could benefit on the “phase one” US-China trade deal.

USD/CAD Technical Analysis
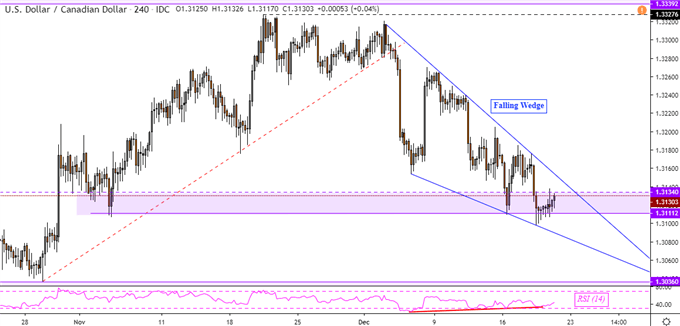
Taking a look at USD/CAD, I have highlighted a Falling Wedge on the 4-hour chart. This is typically a bullish chart pattern. A daily close above the ceiling of the wedge opens the door to perhaps revisiting highs from earlier this month. Positive RSI divergence showed fading downside momentum as prices struggled to clear key support at 1.3111. Extending the downtrend places the focus on October lows.
| Change in | Longs | Shorts | OI |
| Daily | 25% | -12% | 2% |
| Weekly | 91% | -29% | 0% |
USD/CAD 4-Hour Chart

NZD/CAD Technical Analysis
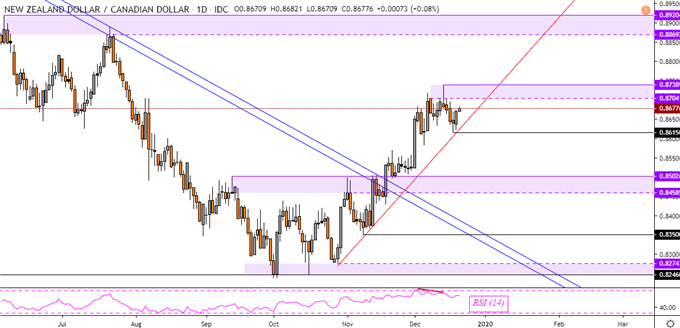
Softer Canadian GDP data will likely add fuel to the advance in NZD/CAD after pushing above key falling resistance from March. While there has been a cautious pullback off resistance (0.8704 – 0.8738), rising support from October has been maintaining the uptrend – red line on the chart below. A daily close under 0.8615 opens the door to targeting the psychological barrier between 0.8458 to 0.8502.
NZD/CAD Daily Chart

--- Written by Daniel Dubrovsky, Currency Analyst for DailyFX.com
To contact Daniel, use the comments section below or @ddubrovskyFX on Twitter


