

AUD/USD OUTLOOK, ASX 200 TECHNICAL ANALYSIS – Talking Points:
- ASX 200 sinks as downbeat US data, deepening trade war sours market mood
- Rising AUD/USD, local yields flag ebbing RBA rate cut bets as another factor
- Australian stocks may be signaling renewed Aussie Dollar selling due ahead
Where will markets end 2019? See our Q4 forecasts for currencies, commodities and stock indexes !
Australia’s benchmark ASX 200 stock index recoiled from resistance marked by July’s swing topat 6875.50, suffering the largest daily drop in two months. Downbeat US economic data and signs of trade war escalation fueled broad-based selling across global financial markets, pulling Sydney-listed names down alongside broader liquidation.
The 6604.20-34.70 price inflection zone is in focus from here. It has served as both support and resistance amid broadly sideways trade since late June. Breaking below this on a daily closing would double as a breach of rising trend support guiding the upswing from mid-August lows, tilting the near-term bias to the downside. Swing lows 6475.40 and 6396.00 line up as supports thereafter.
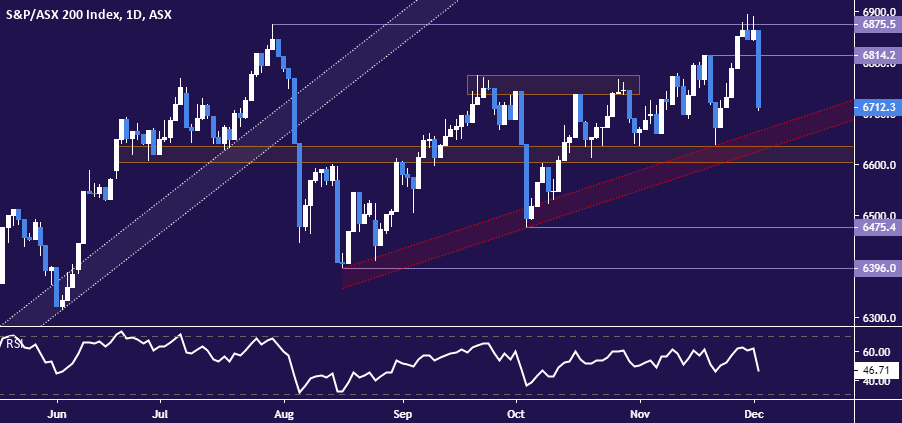
ASX 200 chart created with TradingView
A parallel rise in the Australian Dollar and local bond yields hints that shifting RBA policy bets may be amplifying macro-level forces pressuring the ASX. The move implies ebbing rate cut bets, a conclusion bolstered by recent changes in the implied outlook priced into rates futures. They put the probability of a cut at next year’s first meeting at 51 percent, down from 74 percent just two days ago.
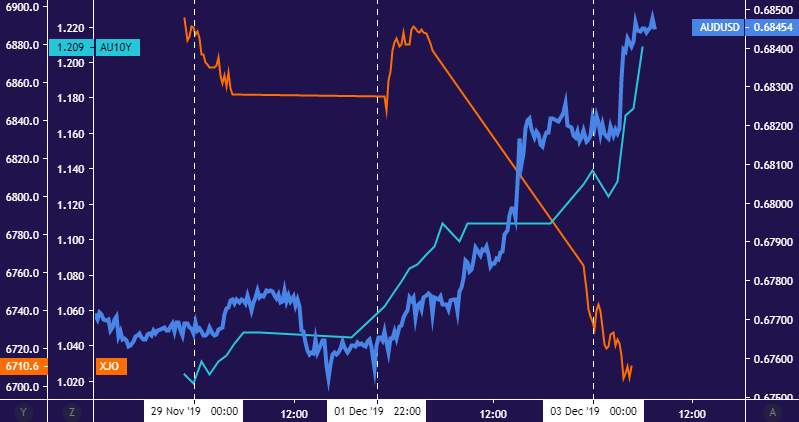
ASX 200, AUD/USD chart created with TradingView
This seems suspect. Firm Chinese PMI data was cited in Monday’s moderation of RBA rate cut chances, but signs of a broadening trade war might have offset it if not for a cautiously upbeat tone from the central bank itself. This may not last however as global growth slows and tensions deepen. One top Australian bank already envisions RBA QE on the horizon.
Tellingly, Australian shares’ losses deepened as the Aussie Dollar rose alongside rates after the central bank said some of the downside risks facing the global economy “lessened recently. Were traders heartened, the outcome for the ASX may have been different. Instead, it flags fears about insufficient policy support ahead. If this foreshadows a need for the RBA to reconsider, AUD may be right back on the defensive.
ASX 200, AUD/USD TRADING RESOURCES
- Just getting started? See our beginners’ guide for FX traders
- Having trouble with your strategy? Here’s the #1 mistake that traders make
- Join a free webinar and have your questions answered
--- Written by Ilya Spivak, Currency Strategist for DailyFX.com
To contact Ilya, use the comments section below or @IlyaSpivak on Twitter