


MEXICAN PESO IMPLIED VOLATILITY SPIKES AS FINANCE MINISTER RESIGNS
- USDMXN implied volatility measures are on the ascent amid rising economic and political uncertainty
- Spot USDMXN could remain bid despite bearish US Dollar fundamentals surrounding Fed rate cuts
- Download free Q3 Forecasts from DailyFX for comprehensive fundamental and technical outlook on a range of currencies, gold, oil and equities
The Mexican Peso remains under pressure after Carlos Urzua, Mexico’s Minister of Finance, abruptly resigned from his post and the President Andreas Manuel Lopez Obrardor’s (AMLO) administration. USDMXN jumped sharply immediately after news crossed the wires that Urzua suddenly stepped down from his post with the Peso being weighed down by negative speculation over Mexico’s economic and political affairs.
With a top official like Minister of Finance resigning unexpectedly, it raises the question about political stability within Mexico. President AMLO has been under increasing scrutiny as he continues to fall short of campaign promises and economic benchmarks and former Minister of Finance Urzua was a stark critic of Mexico’s leader.
In Urzua’s resignation letter posted on his Twitter account, he stated “there have been many discrepancies in economic matters,” adding that policy decisions being made within AMLO’s administration were done “without sufficient foundation” and should instead “be based on evidence” and “free from all extremism.”
SPOT USD/MXN IMPLIED VOLATILITY: DAILY TIME FRAME (JANUARY 01, 2019 TO JULY 10, 2019)
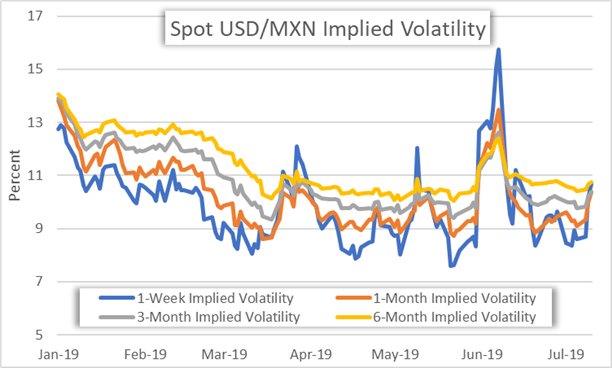
USDMXN implied volatility readings across various tenors have spiked to multi-week highs in response to growing uncertainty in Mexico with the metrics gearing up to keep climbing. A string of downbeat developments like Mexico GDP contracting by 0.2% reported at the end of April and Banxico cutting GDP outlook later in May – in addition to President Trump threatening Tariffs on Mexico and the recent reshuffling of Mexico’s finance minister – all seem likely to keep spot USDMXN bid despite bearish US Dollar fundamentals surrounding Fed rate cut expectations.
USD/MXN PRICE CHART: 4-HOUR TIME FRAME (MAY 30, 2019 TO JULY 11, 2019)
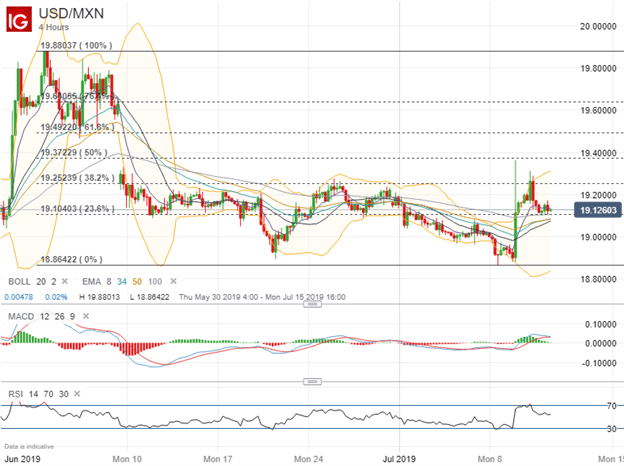
Looking to the charts, yesterday’s news of Mexican Finance Minister Urzua abruptly resigning sent spot USDMXN surging 2% higher before giving back some of the gains. Spot USDMXN now eyes technical support from the 23.6% Fibonacci retracement level drawn from the high in June to low in July. Additionally, rising exponential moving averages could provide another layer of buoyance to spot USDMXN.
For bullish momentum to continue, however, it will be important for USDMXN forex traders to top the 19.2 handle and 38.2% Fib level. If this zone can be cleared, it could open up the door for further gains as spot rates may aim higher to close the gap lower recorded on May 10 from the 19.6 price level after news broke out that US President Trump opted not to move forward with tariffs on Mexico.
USD/MXN PRICE CHART: WEEKLY TIME FRAME (OCTOBER 23, 2016 TO JULY 11, 2019)
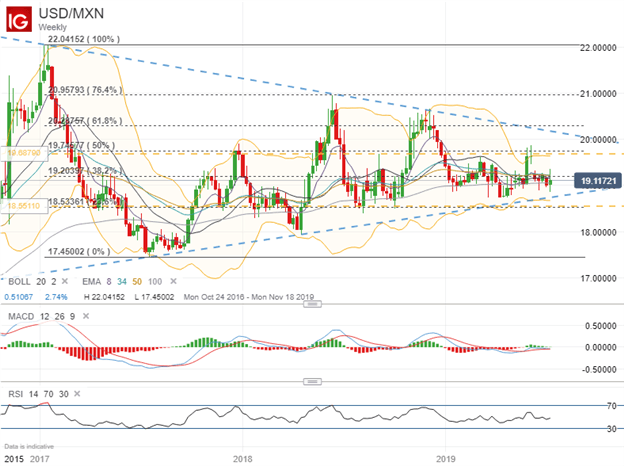
Zooming out to a longer-term time frame, a clear consolidation pattern on the weekly spot USDMXN chart seems to have developed since early 2017 from a series of lower highs and higher lows. Now, spot USDMXN could continue to wedge with spot prices remaining rangebound over the next several weeks. This ‘sideways’ scenario may warrant further credence in consideration of the mixed fundamental forces at play mentioned above.
That said, currency option traders are expecting spot USDMXN to fluctuate between 18.551 and 19.688 over the next 30-days with a 68 percent statistical probability judging by the currency pair’s 1-month implied volatility reading of 10.37 percent. The 1-standard deviation upper and lower bounds just so happen to align closely with the 23.6% Fib and 50.0% retracement levels of spot USDMXN’s trading range dating back to January 2017. These areas of confluence have potential to serve as additional support and resistance levels respectively for spot USDMXN over the medium term.
-- Written by Rich Dvorak, Junior Analyst for DailyFX.com
Connect with @RichDvorakFX on Twitter for real-time market insight


