


US Recession Watch Talking Points:
- A key spread in the US Treasury yield curve – the 3m10s – is now suggesting that there is nearly a 33% chance of a recession hitting the United States within the next 12-months.
- The US yield curve inversion comes as US growth concerns around the US-China trade war have provoked the Federal Reserve into a more dovish policy stance.
- US recession fears thanks to the US-China trade war now see a 90% chance of 50-bps of interest rate cuts by the end of the year, and a 51% chance of 75-bps of interest rate cuts.
See the DailyFX Economic Calendar and see what live coverage for key event risk impacting FX markets is scheduled for next week on the DailyFX Webinar Calendar.
The dog days of summer are here. Now that we’ve passed the Fourth of July holiday in the United States, markets begin the long slog to early-September US Labor Day holiday. The coming weeks will likely be marked by lower liquidity and lighter market participation – if this is a typical summer. But a quick check of the geopolitical landscape suggests summer 2019 will be anything but typical for traders.
Why should traders be expecting more volatility across markets in sumer 2019, more than in years past? We’d be hard-pressed to forget about Brexit, the changing European Central Bank leadership, North Korean denuclearization efforts, and accelerating Iranian nuclear proliferation. Yet none of these compare to the impact that the US-China trade war is having on the US Dollar, via Federal Reserve policy and the rising potential for interest rate cuts in the coming months.
Fears of a US economic slowdown thanks to the US-China trade war are proving to be the most influential factor in markets right now, by way of shifting US growth expectations and the collateral impact on Federal Reserve interest rate expectations. Indeed, it would appear that markets are signaling that the probability of a US recession is starting to increase.
US Growth Expectations Should Stabilize After June US Jobs Report
Based on the data received thus far about Q2’19, the Atlanta Fed GDPNow forecast is looking for growth at 1.3%. The next update to the Q2’19 forecast will be released after Wednesday’s US economic data. But traders should be looking for a slight improvement in the near-term, particularly after the better than expected June US jobs report on Friday.
Atlanta Fed GDPNow Q2’19 US GDP Estimate (July 8, 2019) (Chart 1)
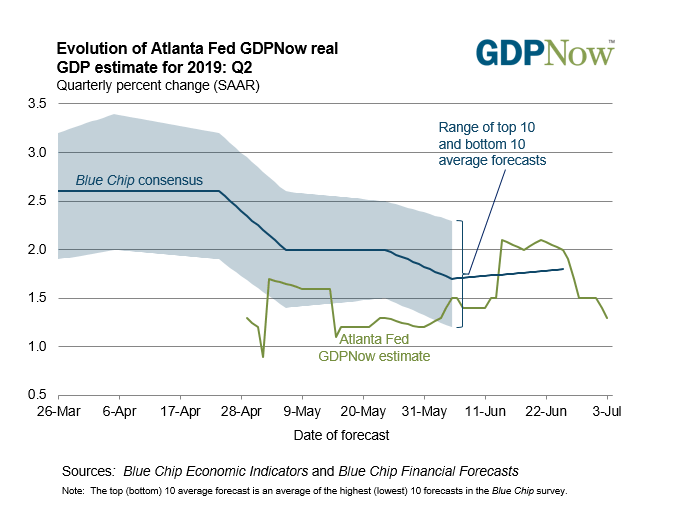
Evidence that the US labor market – the pillar of the US economy during the post-Great Recession recovery – remains sturdy will help ward off recession fears in the immediate future. Overall, US economic data momentum has been on a downward path over the past several months, with the Citi Economic Surprise Index for the US falling from its yearly high at 27.1 on February 1 to -55.8 today.
Fed Rate Cut Expectations Ebb and Flow
Even with the US-China trade war in a state of détente after the G20 summit in Osaka, Japan, market participants feel strongly that the Federal Reserve will act to shore up the US economy over the coming months – with the explicit purpose of staving off a recession and ending the longest run of economic growth in US history.
At the start of May, there was a 68% chance of 25-bps rate cuts by the end of the year, according to Fed funds futures. How drastic rate odds have changed in the past two months:
Federal Reserve Interest Rate Expectations (July 8, 2018) (Table 1)
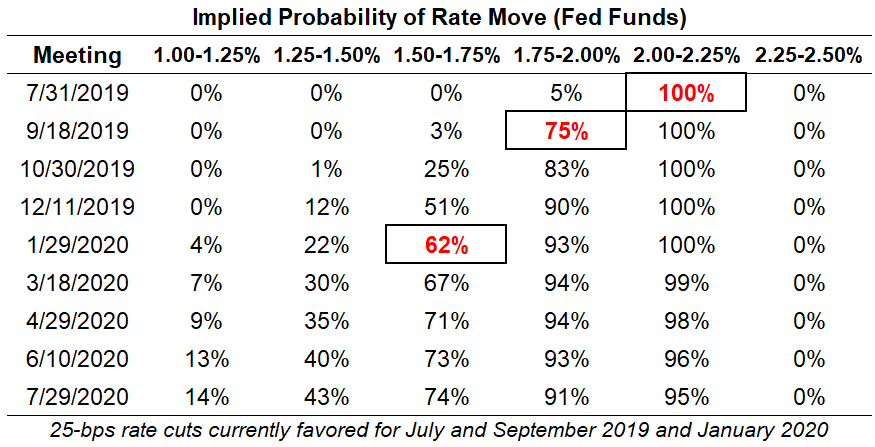
According to Fed funds futures, after the June US jobs report, there is now a 100% chance of a first 25-bps rate cut in July. Overall, there is a 90% chance of 50-bps of interest rate cuts by the end of the year, and a 51% chance of 75-bps of interest rate cuts.
Using the US Yield Curve Inversion to Predict Recessions
The impact of the US-China trade war has been felt two-fold on the US yield curve. With Fed funds pricing in a greater likelihood of lower short-term rates, the short-end of the US yield curve has fallen. Second, with growth expectations depressed, the long-end of the US yield curve has fallen. However, this has been a non-parallel shift in the US yield curve; this “flattening” of the US yield curve is foreboding for the US economy.
US Treasury Yield Curve (July 8, 2019) (Chart 2)
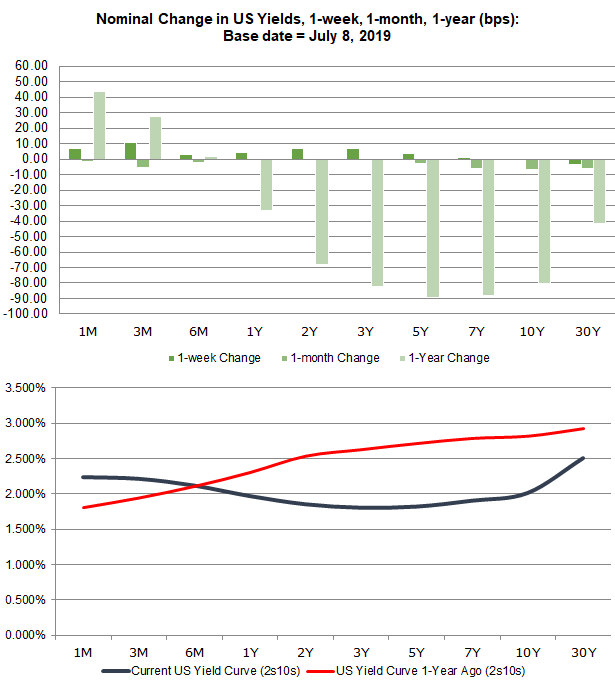
A flattening yield curve typically suggests an environment of rising uncertainty over growth conditions. In context of recent news and data, it stands to reason that the US-China trade war is proving to be the driving factor behind this shift in sentiment. The key question for traders to consider over summer 2019 is, “are the odds of a US recession rising?”
Why Does the US Yield Curve Inversion Matter?
The yield curve, if it’s based on AA-rated corporate bonds, German Bunds, or US Treasuries, is a reflection of the relationship between risk and time for debt at various maturities. A “normal” yield curve is one in which shorter-term debt instruments have a lower yield than longer-term debt instruments. Why? Put simply, it’s more difficult to predict events the further out into the future you go; investors need to be compenstated for this additional risk with higher yields. This relationship produces a positive sloping yield curve.
When looking at a government bond yield curve (like Bunds or Treasuries), various assessments about the state of the economy can be made at any point in time. Are short-end rates rising rapidly? This could mean that the Fed is signaling a rate hike is coming soon. Or, that there are funding concerns for the federal government. Have long-end rates dropped sharply? This could mean that growth expectations are falling. Or, it could mean that sovereign credit risk is receding. Context obviously matters.
Read more: Why Does the US Yield Curve Inversion Matter?
US Treasury Yield Curves: 3m10s and 2s10 (1975 to 2019) (Chart 3)

Duke University finance professor Campbell Harvey, whose 1986 dissertation explored the concept of using the yield curve to forecast recessions, has said that the yield curve needs to invert in the 3m10s for at least one full quarter (or three months) in order to give a true predictive signal (since the 1960s, a full quarter of inversion has predicted every recession correctly). With the 3m10s spread inverted, the probability of a US recession is rising.
NY Fed Recession Probability Indicator (July 8, 2019) (Chart 4)
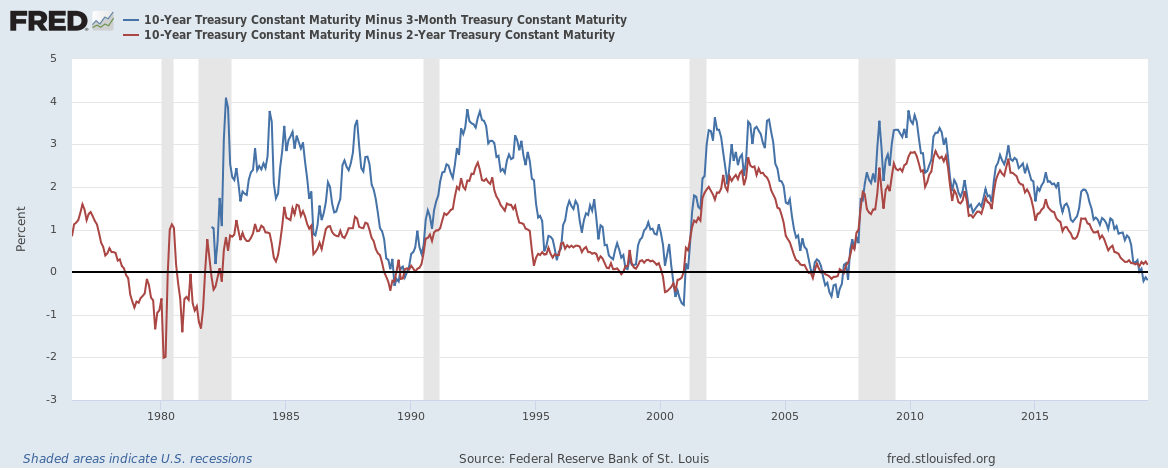
Using the 3m10s spread, the NY Fed Recession Probability Indicator is now suggesting a 33% chance of a recession hitting the US economy within the next 12-months. Thus lies a chain of events that traders need to monitor over the coming months: (1) will the US-China trade war deepen? (2) how will the Fed respond with rate cuts? (3) does the US-China trade war tip the global economy into recession?
Conclusions about US Yield Curve Inversion and Rising Recession Odds
Summer 2019 is unlikely to be the typically slower trading period that the middle of the year represents. Geopolitical tensions continue to rise across the globe, and the US-China trade war has yet to make meaningful progress towards resolution. As the path forward is uncertain, traders should anticipate rising volatility in FX markets; that EUR/USD implied volatility is at all-time lows is a dangerous red herring.
FX TRADING RESOURCES
Whether you are a new or experienced trader, DailyFX has multiple resources available to help you: an indicator for monitoring trader sentiment; quarterly trading forecasts; analytical and educational webinars held daily; trading guides to help you improve trading performance, and even one for those who are new to FX trading.
--- Written by Christopher Vecchio, CFA, Senior Currency Strategist
To contact Christopher Vecchio, e-mail at cvecchio@dailyfx.com
Follow him on Twitter at @CVecchioFX
View our long-term forecasts with the DailyFX Trading Guides


