


S&P 500 Equity Analysis and News
- G20 Ceasefire on the Way
- Mnuchin Jawboning, However, we Have Seen This Before
Ceasefire on the Way
Last week we noted that we where getting a sense of déjà vu ahead of the G20 summit with the upcoming meeting between President Trump and Xi likely to yield similar results to last November (full analysis), in which both parties agreed a ceasefire. Reports yesterday confirmed as much with sources noting that the US are set to delay more China tariffs as talks are expected to resume, as such, concerns over a further escalation in trade war tensions has eased.
Mnuchin Jawboning, However, we Have Seen This Before
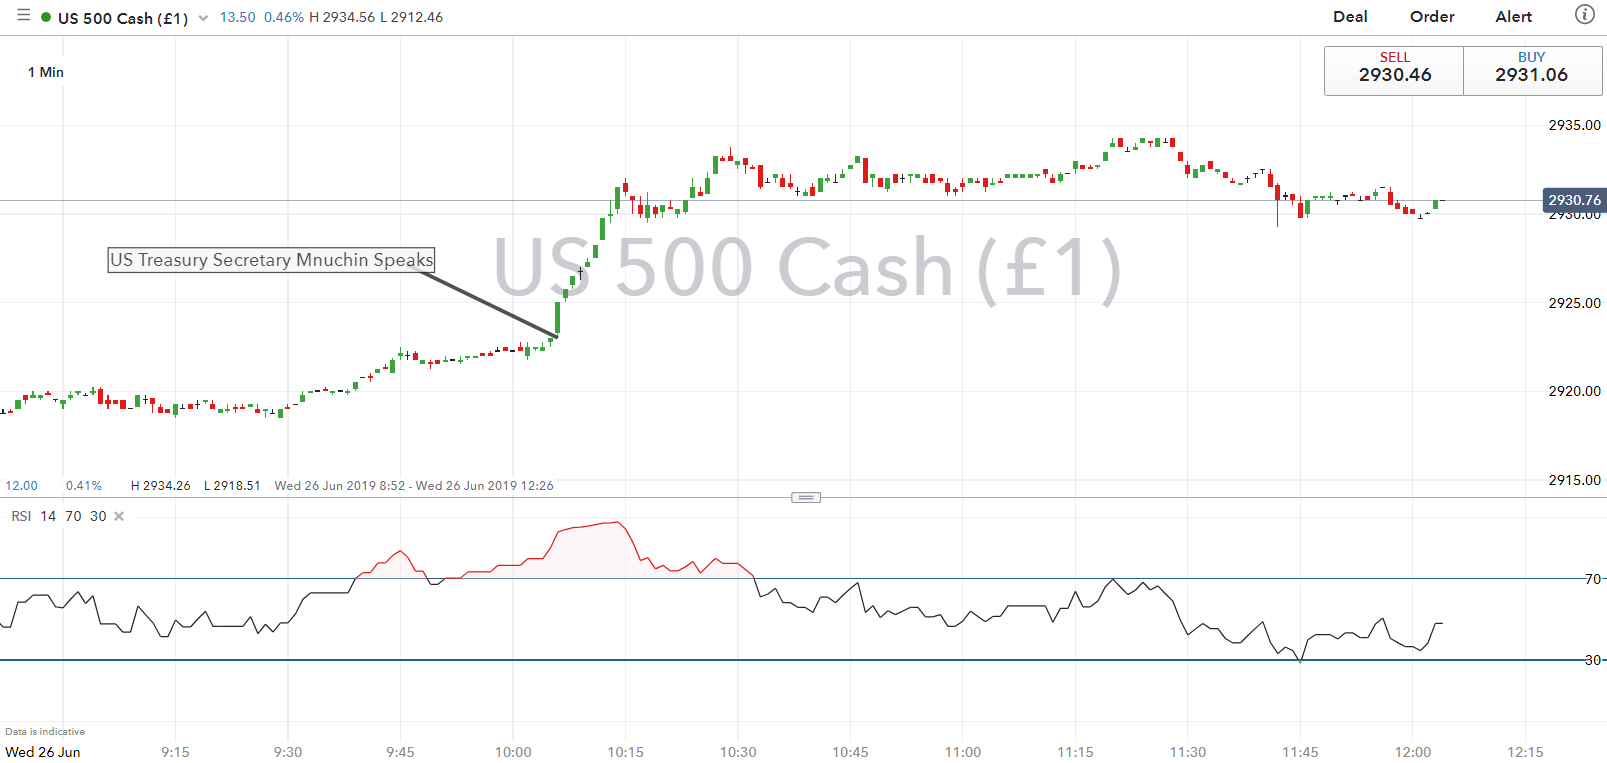
The latest uptick in US equity futures has been spurred by comments from US Treasury Secretary Mnuchin who stated that the US-China trade deal is 90% complete. This appears to be typical jawboning from Mnuchin, given that these comments are largely a reiteration as to what has been said previously back in April and May. Thus, the recent bounce in equity markets seem to be somewhat dubious and are at risk of being pared.
S&P 500 Price Chart: 1-Minute Time Frame (intra-day)
S&P 500 | Technical Outlook
The S&P 500 remains elevated with the latest uptick attributed to comments from Mnuchin, which raises scope of a test of 2960-65 resistance, which represents the rising trendline from prior peaks in the index. However, with the weekly RSI showing a negative divergence there is a risk of a notable pullback in the index, which could accelerate on a break below 2865.
S&P 500 Price Chart: Weekly Time Frame (Jan 16 – Jun 19)

RESOURCES FOR FOREX & CFD TRADERS
Whether you are a new or experienced trader, we have several resources available to help you; indicator for tracking trader sentiment, quarterly trading forecasts, analytical and educational webinars held daily, trading guides to help you improve trading performance, and one specifically for those who are new to forex.
--- Written by Justin McQueen, Market Analyst
To contact Justin, email him at Justin.mcqueen@ig.com
Follow Justin on Twitter @JMcQueenFX


