


NORDIC FX, NOK, SEK WEEKLY OUTLOOK
- USD/SEK may have short-term retreat after massive surge
- USD/NOK re-testing upper bound of rising support channel
- Long term outlook for USD/NOK, USD/SEK remains bullish
See our free guide to learn how to use economic news in your trading strategy !
USD/SEK TECHNICAL ANALYSIS
After stubbornly trading between the 9.2273-9.3310 range for over a month, USD/SEK breached the upper bound and has consistently closed above it for almost a week. The break above 9.3310 with follow-through signals a reinforcement of underlying bullish sentiment that has continued to push the pair higher for over a year.
USD/SEK – Daily Chart

Following the Riksbank rate decision and commentary on April 25 that sent the Krona lower against all major counterparts, USD/SEK is now nervously trading along what looks like new resistance at 9.5323. Despite the pair’s surge, negative RSI divergence shows underlying momentum is waning and could signal a possible short-term retreat as the pair come down from their sugar rush.
Zooming out to a monthly chart also shows that underlying momentum is weakening after having surged over 20 percent since February 2018. The pair is now trading within a 17-year high range with a possible floor at 9.3310, though the more likely alternative looks like the frequently tested support at 9.2275.
At least until year-end, I have a bullish outlook for USD/SEK despite a possible small retreat that may occur in the short run. If you’d like to learn about the fundamental outlook and keep up to date with technical analyses, you may follow me on Twitter @Zabelin.Dimitri.
USD/SEK – Monthly Chart

USD/NOK TECHNICAL ANALYSIS
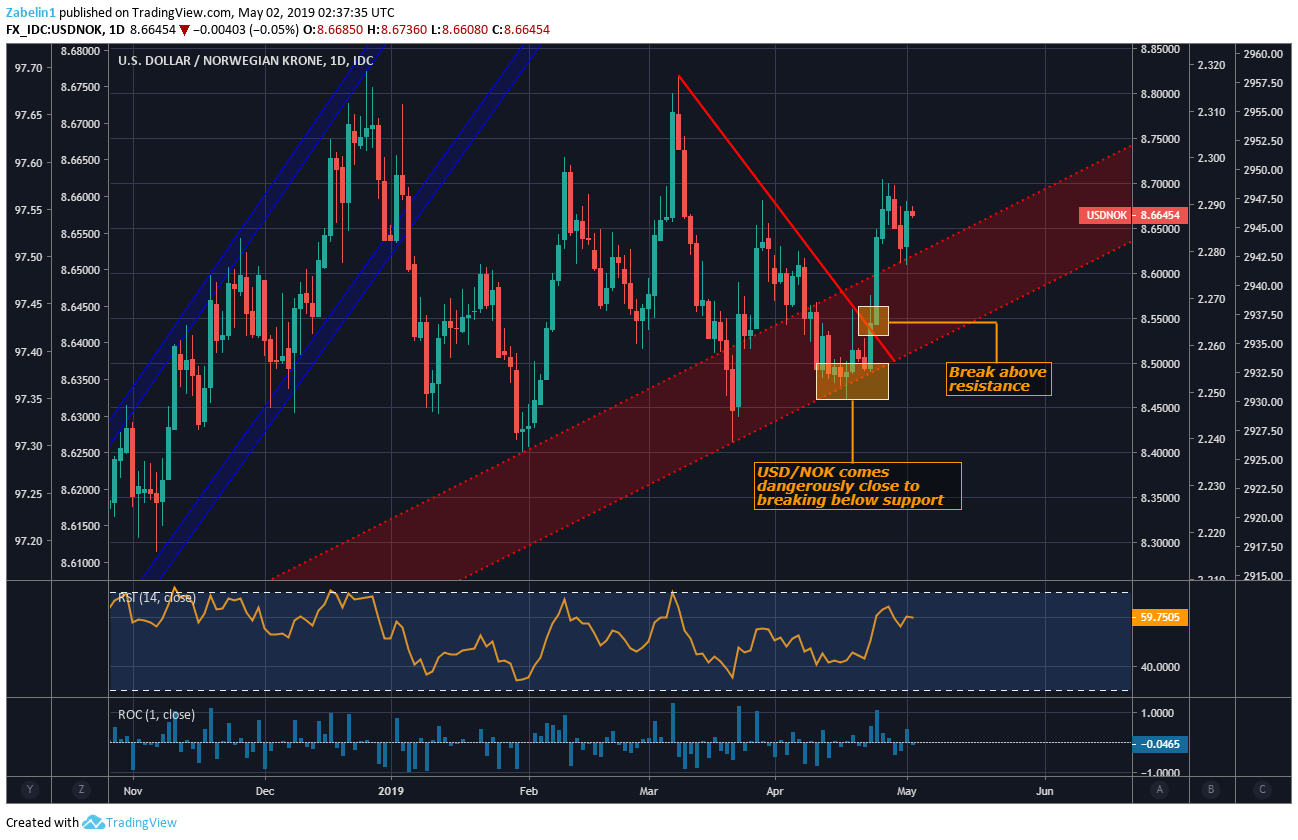
USD/NOK recently bounced up from the lower bound of the upward-sloping support channel. In late April, the pair came dangerously close to breaking below support but managed to avoid breaking below it with follow through. Had that occurred, it may have marked a major bearish reversal. This happened just as USD/NOK approached descending resistance which could have pressured the pair lower.
USD/NOK – Daily Chart
Zooming out to a weekly chart shows how this rising support line holds true at a wider time frame. The week of April 22 was the biggest one-week jump since the week of February 4. This marked a pivotal moment as the pair edged close to breaking below support but subsequently reversed and continued to climb higher.
USD/NOK – Weekly Chart
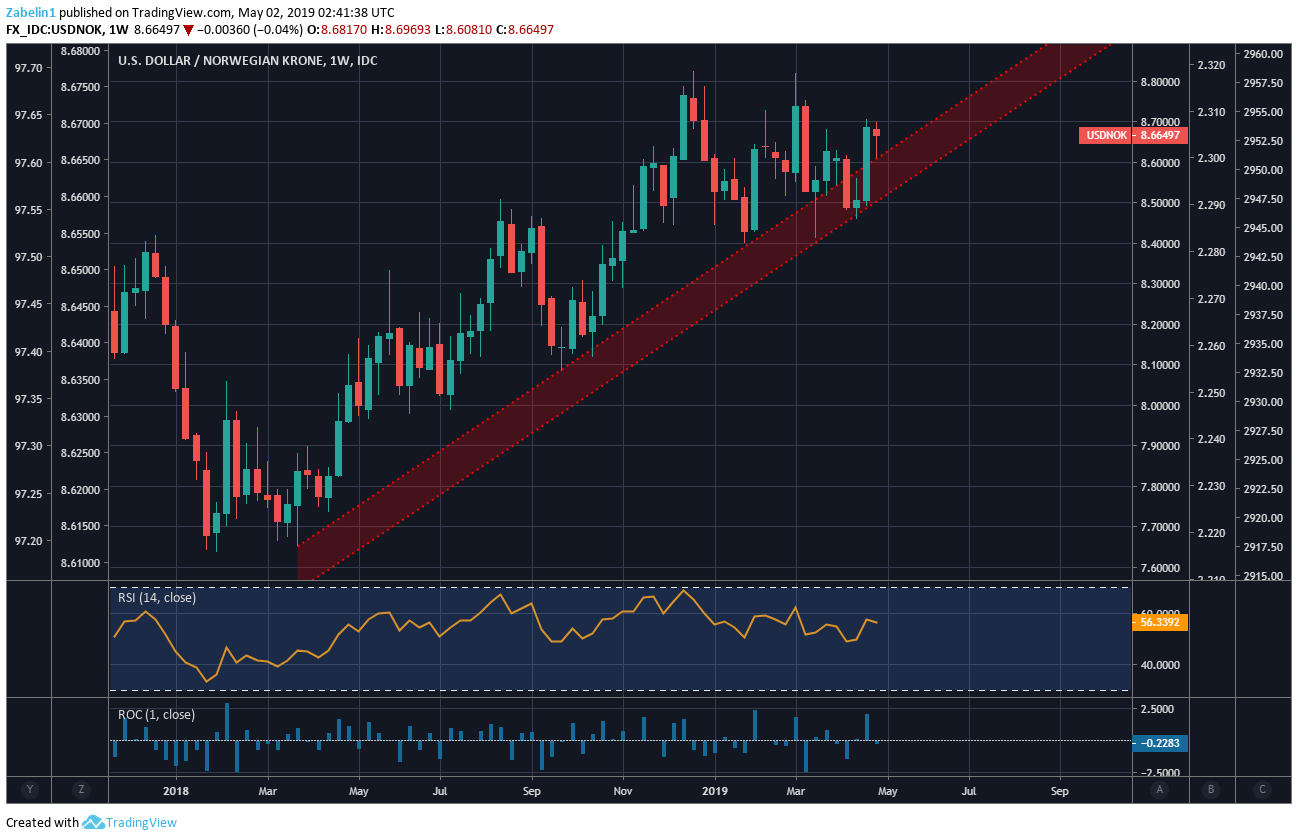
At least until year-end, the outlook remains bullish and the rising support channel will likely continue to hold for the next few months. In the near-term, monitoring whether USD/NOK will continue trade above the upper lip of the channel may signal the degree of underlying bullish sentiment in the pair.
KRONA, NORWEGIAN KRONE TRADING RESOURCES
- Join a free Q&A webinar and have your trading questions answered
- Just getting started? See our beginners’ guide for FX traders
- Having trouble with your strategy? Here’s the #1 mistake that traders make
--- Written by Dimitri Zabelin, Jr Currency Analyst for DailyFX.com
To contact Dimitri, use the comments section below or @ZabelinDimitri on Twitter


