


Stock Market Talking Points:
- The FTSE 100 posted a 126-point recovery to close slightly higher for the first trading session of 2019
- In similar fashion the ASX 200 Australian equity index posted a 97-point rebound
- The lower wicks, or tails, are the largest for the two indices since November 9th, 2016 the day after US President Trump mounted a surprise election victory
The New Year is already off to a volatile start for equity markets with some posting their largest lower wick since the election of President Donald Trump. A lower wick, or tail, appears when a decline is retraced. The failed move lower creates a wick on the bottom of the candle and particularly long wicks, like those posted Wednesday, are uncommon.
FTSE 100 Price Chart and Wick Lengths Daily, 2016 – 2019

Traders sometimes perceive a tail of such magnitude as a bullish signal, especially when a market is oversold or at support. In the case of the FTSE, the long shadow candlestick on Wednesday poses an intriguing technical setup for bulls heading into Thursday’s open.
The index traded firmly in the red to kick off 2019 but the index eventually mounted a rebound as GBPUSD took a hit. The climb higher subsequently etched the longest tail for the FTSE 100 since November 9th, 2016, the day after Donald Trump was elected President of the United States. Recent stock market volatility has created a series of robust wicks and highlights the knife’s edge markets find themselves on, especially the FTSE which remains tied to ongoing Brexit negotiations.
Volatility was not limited to the United Kingdom’s stock index as the Australian ASX 200 realized similar intraday trading.
ASX 200 Price Chart and Wick Lengths Daily, 2016 – 2019
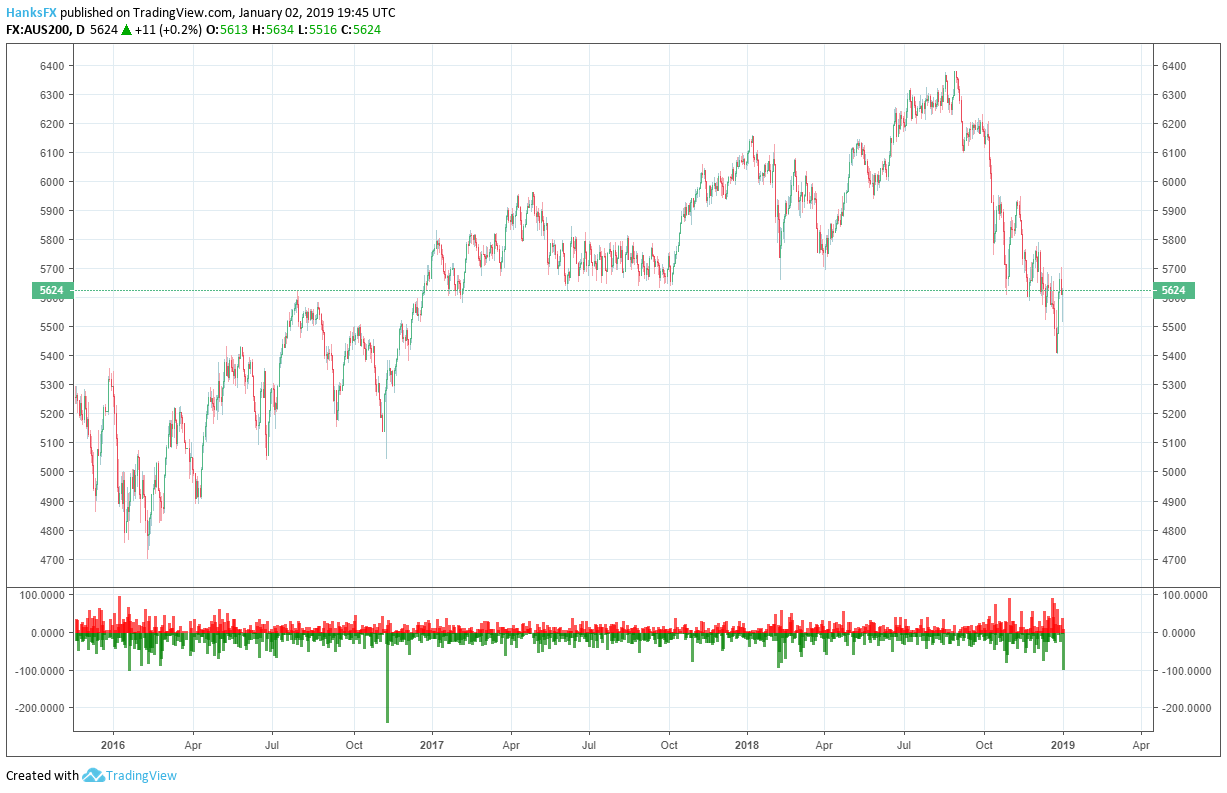
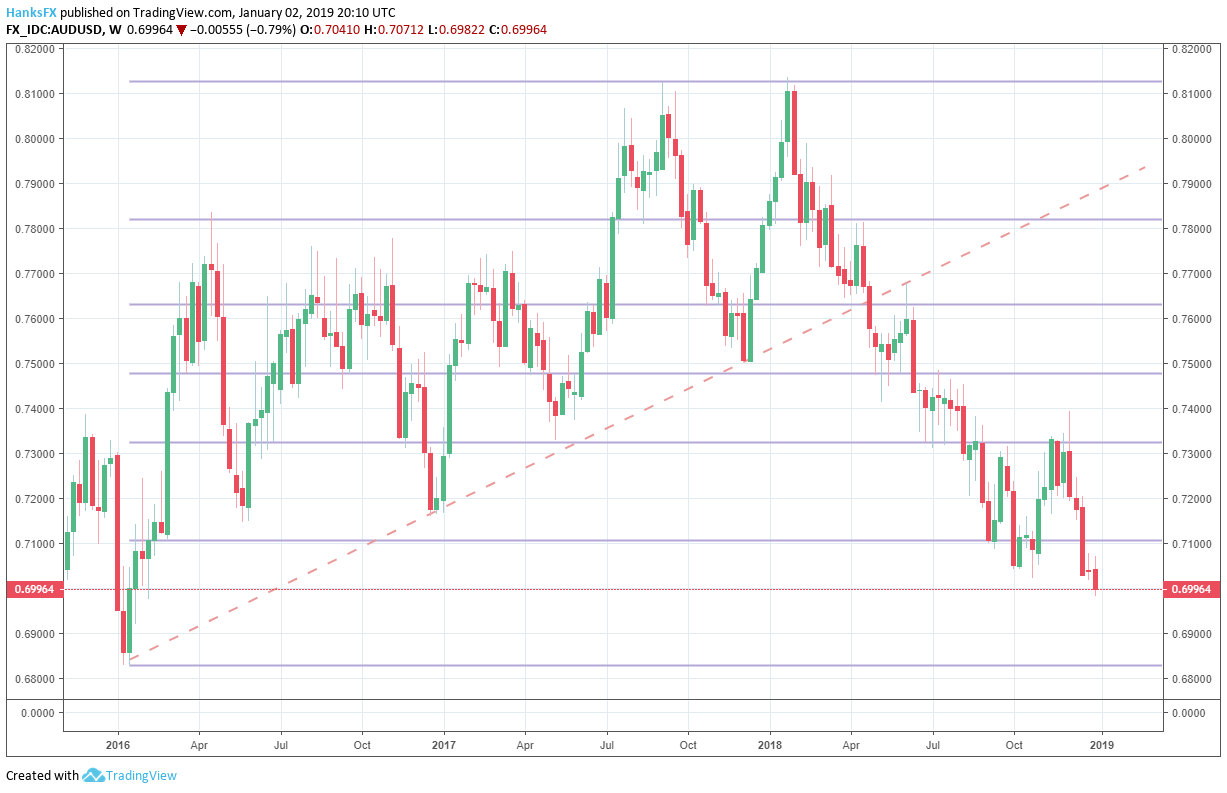
The Australian stock index similarly mounted a rebound which some market watchers attributed to US-China trade war optimism. The move occurred alongside a breakdown in AUDUSD which traded below 0.70 and moved to the lowest level since February 2016. Chinese growth concerns also played a part in the price action as investors weigh the impact of a slowing Chinese economy on Australia’s business and currency outlook.
AUDUSD Price Chart Weekly, 2016 – 2019
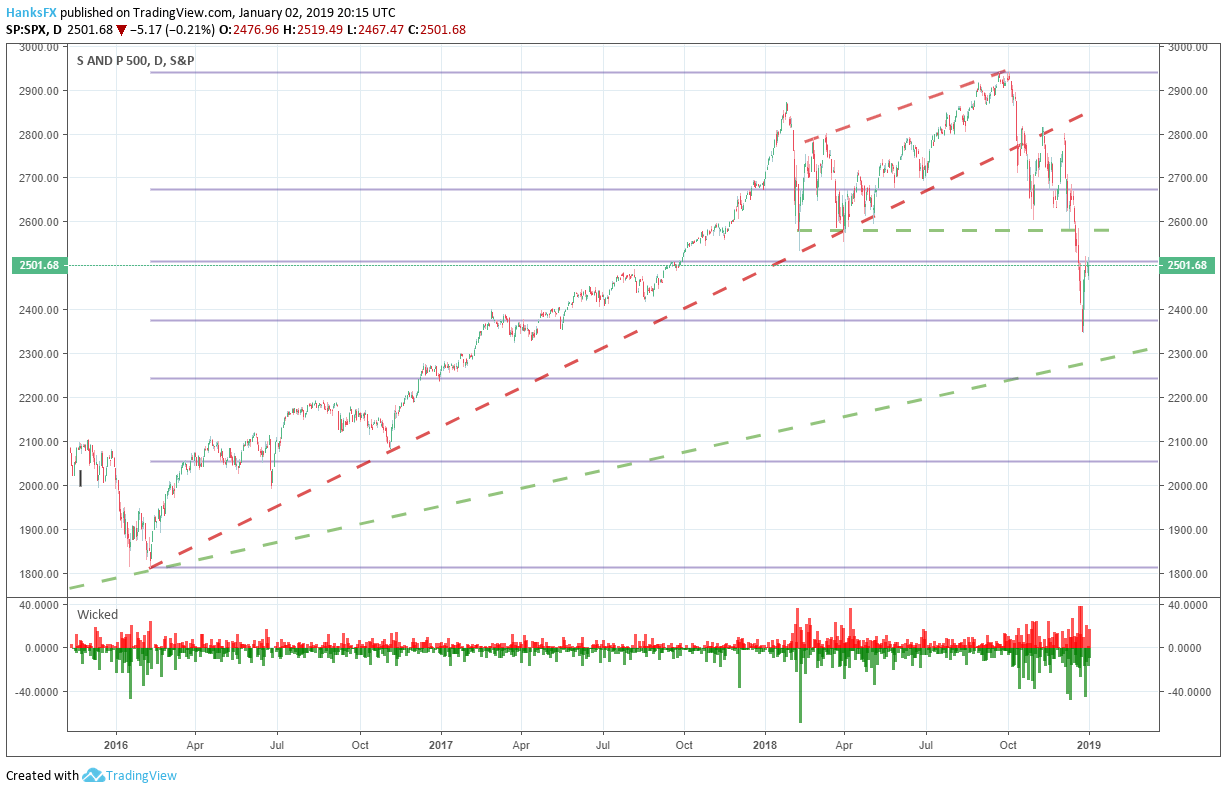
As for the S&P 500, the closing months of 2018 offered consistently robust lower wicks. October through December saw some of the longest tails since 2016 barring a particularly volatile period last February. The benchmark index was poised to close roughly unchanged in the New Year’s first trading day as it tiptoed around the 2500 level.
S&P 500 Price Chart and Wick Length Daily, 2016 - 2019
Volatility may persist as many headline risks for stock markets remain. President Trump warned the government could remain shuttered for ‘a long time’ while most investors shrugged off conjoining optimistic remarks on the US-China trade war. Elsewhere, Chinese growth concerns dominate.
--Written by Peter Hanks, Junior Analyst for DailyFX.com
Contact and follow Peter on Twitter @PeterHanksFX
Read more: Will the Stock Market Crash in 2019?
DailyFX forecasts on a variety of currencies such as the US Dollar or the Euro are available from the DailyFX Trading Guides page. If you’re looking to improve your trading approach, check out Traits of Successful Traders. And if you’re looking for an introductory primer to the Forex market, check out our New to FX Guide.


