


Trade War Impact - Talking Points:
- Why does the trade war matter to financial markets and what do traders need to know?
- With US tariff threats rising to $500 Billion the Yuan has weakened and raised concern over Chinese growth – though President Trump has not let up on his critique of currency and policy
- Through price action, a moving average based indicator, and option premiums, it seems USD/CNH bulls have taken over
- After finding resistance at a trend-line dating back to 2011. RSI shows bearish divergence, which may indicate more weakness ahead.
Why U.S Tariffs Pose a Serious Threat to China
As President Trump enforces tariffs on Chinese goods, it is natural to evaluate who has the ‘upper hand’. While the outcome of the trade wars is unpredictable given the many moving parts, we can use macroeconomics to can weigh the baseline cost to see which economy is more dependent on trade for economic growth.
Data source: Bloomberg
Data source: Bloomberg
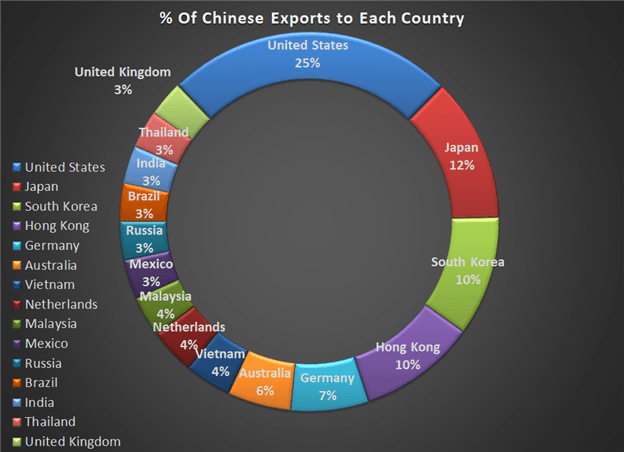
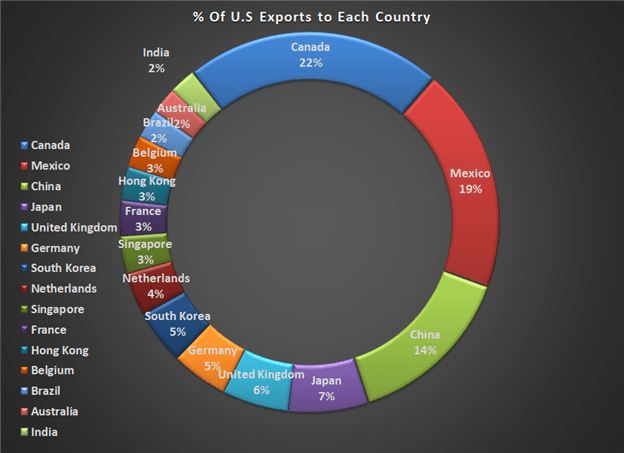
Currently, China exports almost a third of their goods solely to the US. Conversely, the U.S only exports 14% of their goods to China. If we account for how much each country depends on trade for GDP growth, the difference becomes clear.
China’s exports account for approximately 20% of GDP per Bloomberg. US exports account for around 12% of GDP. In other words, China has significantly more exposure to a drop in demand for their exports.
From these two measures, we can evaluate just how much is at risk in GDP terms. The US exports only 1.7% of GDP to China while China exports 5% of GDP to the U.S. In these simple terms, the US has a clear advantage in terms of leveraging pressure on its trade counterpart or has a broader margin of safety if demand drops due to the tariffs.
Read more on the US China Trade War developments
Weakening Yuan Helps to Explain an 18% Drop in Copper Prices
China is the world’s third-largest economy if you combine the EU as a collective. As the market weighs the impact that trade wars exact on the Asian giant, we find the currency is also responding. The Yuan has weakened dramatically – some attributing it to economic impact via growth and others through a speculation that officials are exerting influence to counteract the economic pinch. Regardless, of which risk is most influential, the economic outlook will feel the pressure; which in turn reduces demand for commodities such as base industrial.
As an industrial metal, copper prices are a growth-commodity in that their value is heavily tied to the global economic outlook. All things being equal, a higher spot price of copper tends to correlate with positive forecasts for the growth whereas a sharp drop in copper - like we have seen in the past few weeks - ties more closely to a slide in economic activity.
Copper prices drop alongside the Yuan
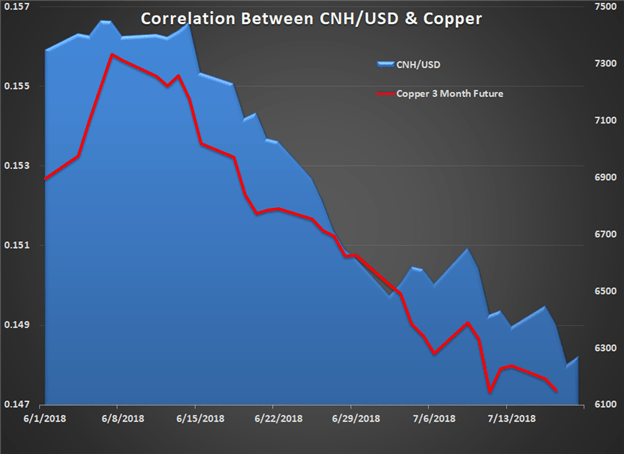
Data source: Bloomberg
Since the beginning of June, the yuan and copper have been highly correlated. Given China’s position as a manufacturing hub for the world and its subsequent demand for the metal, we should see this relationship remain strong moving forward.
The chart above shows copper falling alongside the Chinese currency (the exchange rate is presented as CNH to USD).
Hedge Funds Became Net-Short Copper for the First Time in 2 Years
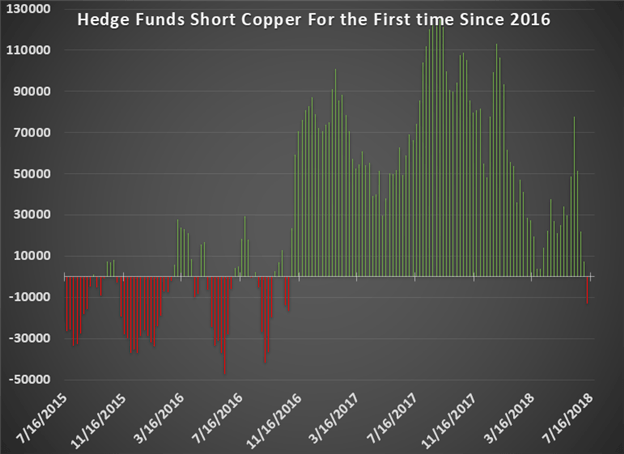
Data source: Bloomberg
Fading outlook for growth and raw material demands has not gone unnoticed by the speculative rank. For the first time in two years, hedge funds are net short copper. A short position allows traders to profit while prices fall. This indicates that hedge funds are betting on further copper weakness.
Weekly Copper Chart Shows Descending Triangle

Chart source: TradingView
Considering the technical picture for copper, the market’s increasing bearish lean has grown more prominent. After a failed bullish break through the open of June, the market rain out of steam around 3.315 and tipped into a 20 percent tumble. Price action suggests copper has secured a downtrend which in turn puts it on course to come upon support which could eventually stand as a broad ‘triangle’. Descending triangles usually indicate further weakness as bears overpower bulls and push prices lower. Look for how copper treats support around 2.5000.
Weekly Copper Chart Shows RSI Divergence
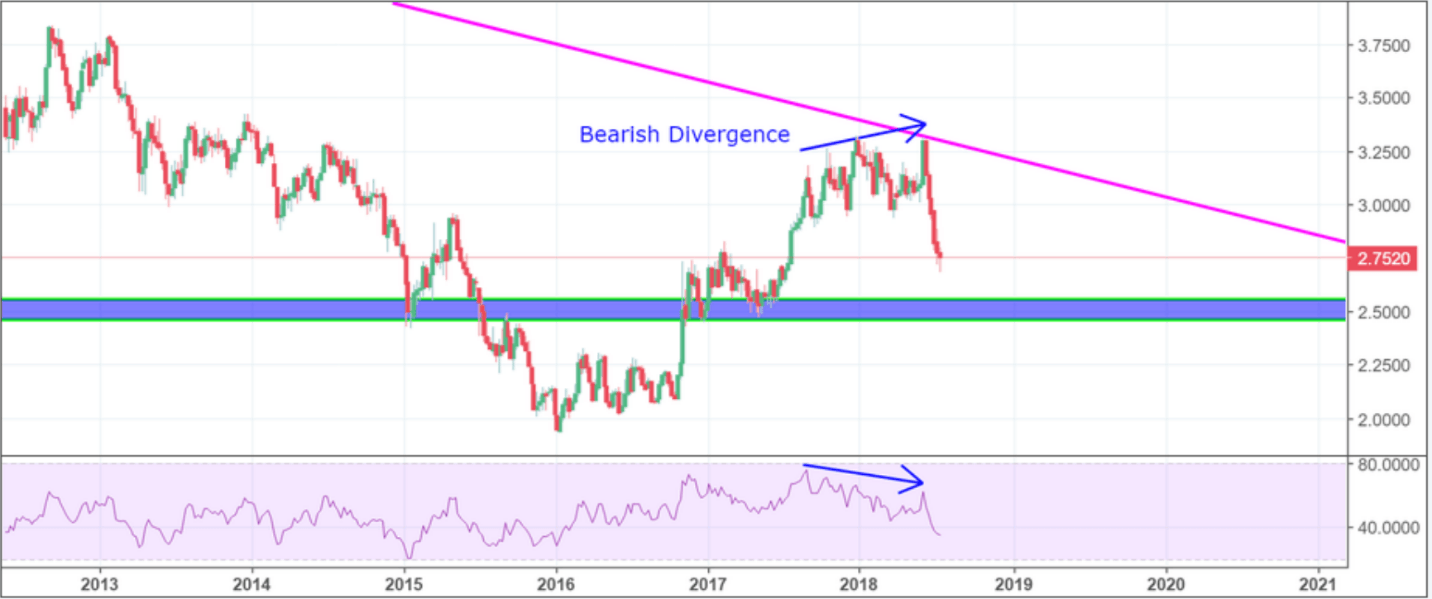
Chart source: TradingView
RSI, a momentum indicator, is offering up another signal of support for bears, showing divergence on the 4-hour chart. Divergence happens when price and a momentum indicator head in opposite direction. In the case of divergence, we usually expect the price to correct towards the bearing of the momentum indicator. Therefore, as the RSI continues to weaken, the technical relationship would suggest sustained decline for the commodity.
Trade Wars Directly Effect USD/CNH Exchange Rate
With the United States and China engaging in a tit-for-tat application of tariffs, it comes as little surprise that the exchange rate between the dollar and yuan (USD/CNH) is weighing which country stands to lose more in the engagement. Accordingly, we have seen a few months of intense climb for the emerging pair – rise for the Greenback and tumble for the Chinese currency – which suggests a clear ‘winner’ and ‘loser’. However, there is plenty of speculation suggesting this performance is not fully an indication of traditional fundamentals. A history of intervention by Chinese authorities make the motivation and future bearing of this pair an open question.
USD/CNH Chart Shows Broken Resistance
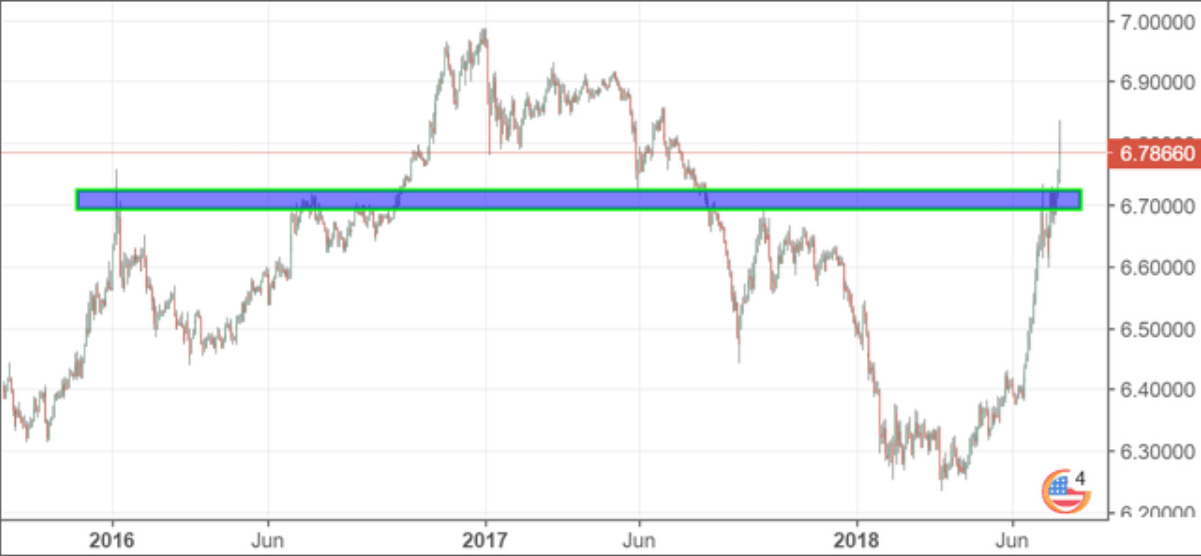
Chart source: TradingView
USD/CNH broke through a level of resistance Wednesday, but its run was interrupted due to remarks from President Trump regarding his concerns of a strong dollar – and suggestion that the yuan was being manipulated. When price breaks resistance, we assume bulls have taken over or bears have given up for now and that prices may continue to higher. Support and resistance levels also offer a great entry point with pre-determined risk.
RSI Shows Bearish Divergence for USD/CNH
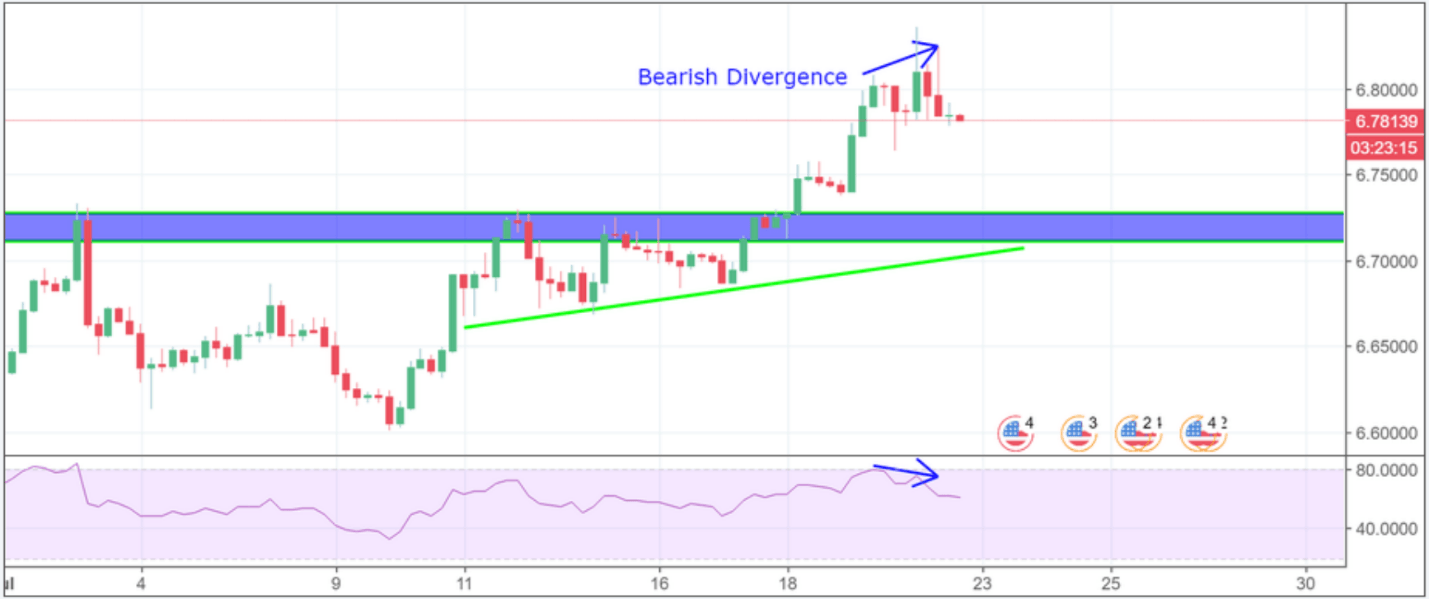
Chart source: TradingView
Returning to the RSI momentum indicator, the signal offers its own bearish divergence for the USDCNH exchange rate. Momentum and price direction conflict, which may lead price to retreat. Often, the market will revisit previous resistance and pause there as a new level of support, also known as a polarity point. However, if price fails to regather bullish conviction and closes below support around 6.69000, this could signal a false breakout (the initial break above 6.7250), and it would be wise to exit a long position.
Guppy Indicator Shows Short-Term Traders Have A Bullish Bias for USD/CNH

Chart source: TradingView
Guppy, an indicator that uses multiple moving averages, further supports a view that short-term traders are bullish USD/CNH. Guppy works by grouping simple moving averages into two categories, short and long-term.
In the chart above, short-term traders are represented in green and long-term traders in red. When both the red and green lines are moving in agreement (both trending up or down) we are given a confirmation of market sentiment. In this case, we assume both short and long-term traders are bullish on USD/CNH. The moving averages may also act as support and/or resistance. For example, when price tests the green moving average zone, we may expect short-term traders to buy more of the pair. Currently, we see short-term traders supporting and pushing prices higher.
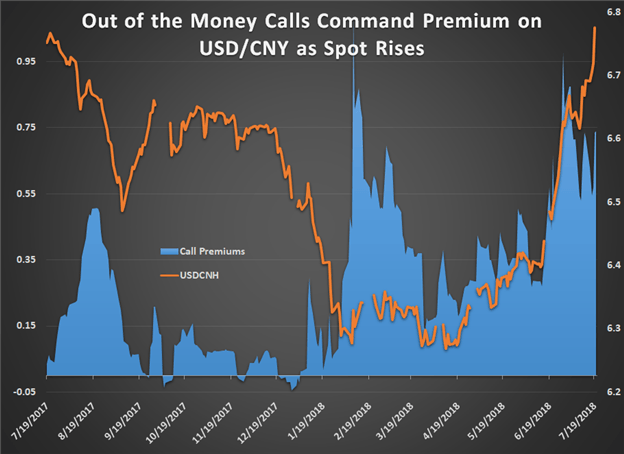
Call Premium (Expected CNH Weakness) Elevated
Data source: Bloomberg
In yet another assessment of the exchange rate, call options are trading at a 70% premium to puts. Call options are another way for traders to profit from an increase in price - or protect from losses if they are short. Call options are a bullish bet, in contrast to put options which are a bearish bet. A call option premium indicates that traders are paying more on the assumption of an advance in the underlying relative to the opposite direction. In this particular case, traders are willing to pay 70% more exposure to a bullish move rather than a bearish one. This premium suggests institutional traders – who represent a greater portion of the options market – are predicting further upside.
Trade War Impact on Copper and USD/CNH – The Bottom line
Both countries are exposed to economic fallout amid trade wars; but when considering basic economic factors and financial balance, China appears to have more to lose. This view can be established through a weakening Yuan and falling copper prices. We shared charts, and technical insights for you to follow these markets in real time as the trade wars progress, but you can also follow the real time news feed of Dailyfx for more developments.
Do you know how to account for volatility when placing important orders, such as your stop loss? The Average True Range will help you determine daily-implied volatility for every currency pair, commodity, and index!
Further reading on the US-China Trade War
- How the US China Trade War will impact equities and safe haven currencies


