


New Zealand Dollar Talking Points:
- New Zealand Dollar is priced in for some intense price action over the coming days
- The currency may rise on the RBNZ rate decision before falling on April’s US CPI
- NZD/USD downside momentum is slowing warning that prices may turn higher next
Just started trading NZD/USD? Check out our beginners’ FX markets guide !
The New Zealand Dollar might be getting ready to push higher against its US counterpart and prices may pause on near-term options-derived resistance. Looking at the table below, NZD/USD one-day implied volatility is at its highest since the lead-up to the New Zealand minority coalition government announcement back in October 2017. The similar one-week measurement is at its largest since March. A couple of key event risks that are coming up may explain why intense price action is priced in.
Implied Volatility and Market Range for the FX Majors

The immediate one is the upcoming RBNZ monetary policy announcement. There, rates are widely anticipated to remain unchanged at 1.75% which means the central bank’s forward guidance could be what fuels New Zealand Dollar volatility. On this front, there may be scope for Kiwi Dollar gains if their new governor Adrian Orr reemphasizes that long-term inflation expectations are still anchored to 2 percent.
Senior Currency Strategist Ilya Spivak will be covering the RBNZ rate decision. Join the webinar and follow NZD/USD’s reaction to it LIVE.
Looking at the immediate chart below, you can see that NZD/USD’s decline since April has also been accompanied with decreasing local inflation estimates. For example, New Zealand’s 10-year breakeven rate, which basically shows the market’s implied inflation rate, has been steadily declining since then. Simultaneously, RBNZ rate expectations 2 years out have also been on the fall.

Just yesterday, NZD/USD declined as RBNZ’s 2-year inflation expectations survey fell to 2.01% in the second quarter from 2.11% prior. Keep in mind that the views expressed in the poll do not represent the central bank’s forecasts. Thus, if Adrian Orr continues to echo the tone that inflation is going higher in the long-run, then we might see some of those pessimistic views on inflation bets unwind and potentially boost the Kiwi Dollar.
For an alternative view of the New Zealand Dollar on the RBNZ rate decision, check out Analyst David Cottle’s article on what he expects on the announcement.
However, gains may not last for long due to the close proximity of Thursday’s US inflation report. There, the headline rate is anticipated to rise to 2.5% y/y in April from 2.4% prior. Signs of rising price pressures could fuel hawkish Fed monetary policy expectations and thus boost the US Dollar. Such an outcome also bodes ill for the New Zealand Dollar which may presumably will no longer boast the highest yield of the FX majors spectrum.
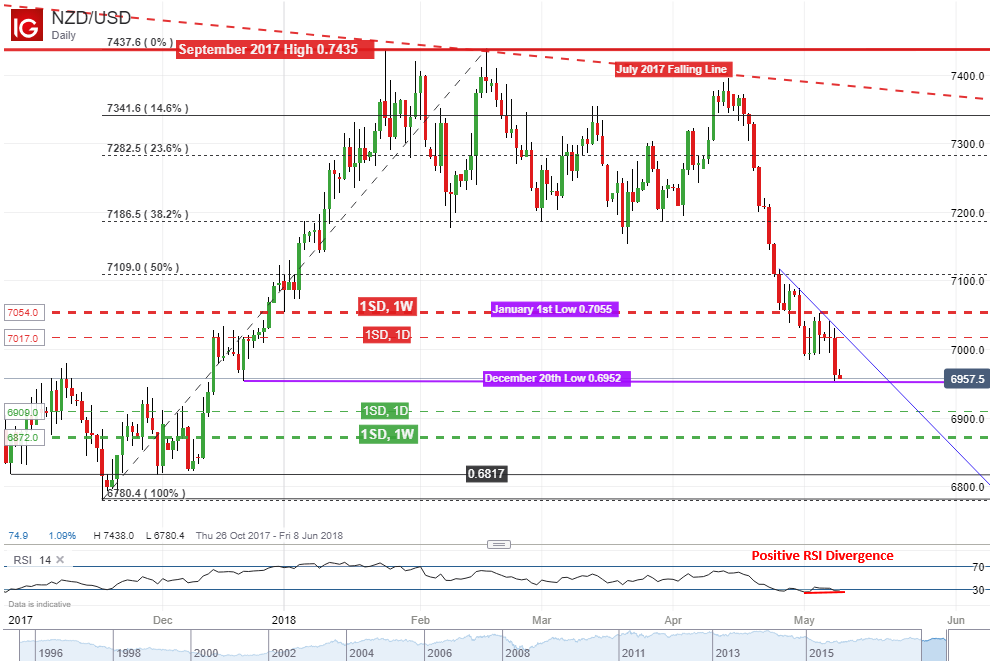
NZD/USD Technical Analysis: Ready for a Bounce?
On a daily chart, NZD/USD finds itself sitting squarely on the December 20th low around 0.6952. The pair has been in an aggressive downtrend since mid-April but there is a warning sign that prices could push higher soon. Positive RSI divergence shows that momentum to the downside is slowing. With that in mind, let us take a look where the pair may go.
From here, immediate resistance is a combination of the “day range high” of 0.7017 and a near-term descending line (blue line on chart below). A push above that exposes the “week range high” at 0.7054. If NZD/USD falls then it could be held up by the “day range low” at 0.6909. A push below that exposes the “week range low” at 0.6872.
NZD/USD Trading Resources:
- Join a free Q&A webinar and have your trading questions answered
- Just getting started? See our beginners’ guide for FX traders
- See how the New Zealand Dollar is viewed by the trading community at the DailyFX Sentiment Page
--- Written by Daniel Dubrovsky, Junior Currency Analyst for DailyFX.com
To contact Daniel, use the comments section below or @ddubrovskyFX on Twitter
To receive Daniel's analysis directly via email, please SIGN UP HERE
https://twitter.com/ddubrovskyFX


