


Fundamental Forecast for USOIL: Bullish
Talking Points:
- Crude set for biggest weekly gain since July on escalating geopolitical risks, demand premium
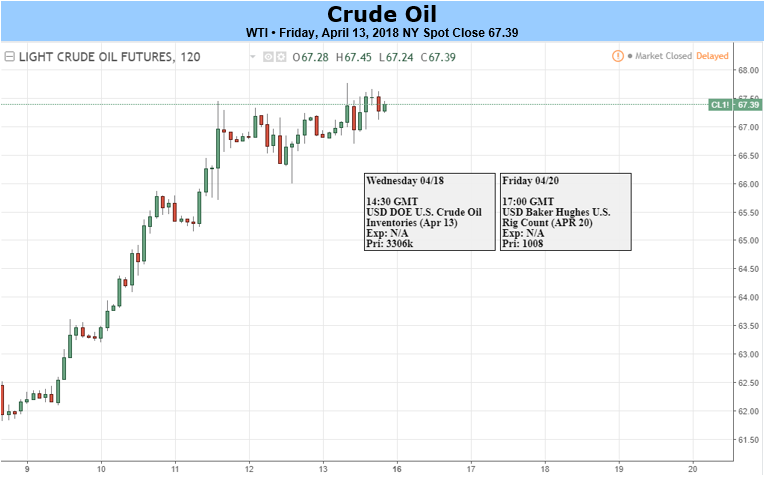
- EIA data took a back seat to geopolitical risks that took Crude to highest levels since Dec. 2014
- Per BHI, U.S. Oil Rig Count rises 7 to 815, US Total Rig Count at 1,008
- IGCS shows growing net-short retail positioning in WTI - US Oil, favoring bullish pressure
Crude oil was at the epicenter of geopolitical risk last week due to Yemeni missiles heading for Riyadh being intercepted and US President Trump threatening a barrage of missiles toward Syria. In a change of events, the reduction of trade war threats was replaced with possible real war, which was a concoction that caused oil bulls to bid the commodity market to the highest levels since 2014 and pushed WTI Crude closer to $70/bbl.
Volatility Now Brings Upside Price Risk That Also Includes Inflation Risks
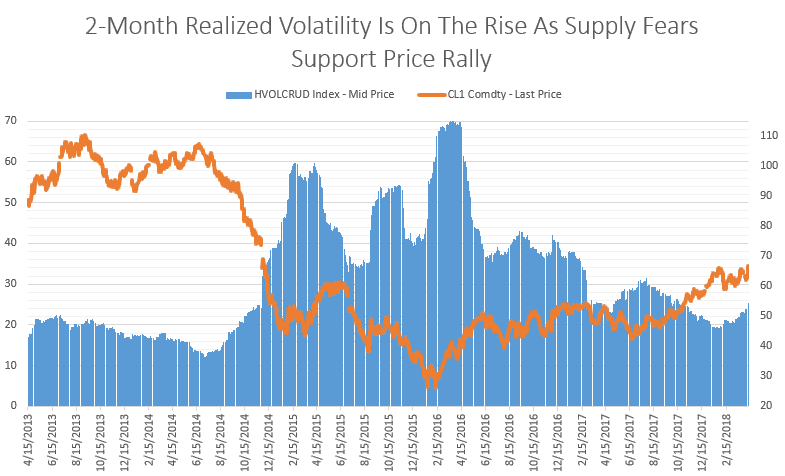
Data source: Bloomberg
Traditionally, volatility is accompanied by downside price shocks. As you can see above, 2-month realized volatility spiked when price bottomed in early 2016. However, recently we’ve seen 2-month realized volatility at the highest levels of the year with price pushing to the highest levels since December 2014.
The increase in crude oil is incredibly important as it often brings inflation behind it as a key macro development. Inflation has been called the silent killer of bull markets that appears to be making a comeback with a perfect storm seems to set up commodities as Goldman Sachs said this week that the case for owning commodities has rarely been this strong.
Additionally, OPEC said its output fell to the lowest in a year last month while the IEA has said demand remains on track with previous estimates. This combination suggests global markets are poised to tighten sharply, which could exasperate the upside and extend backwardation.
Also, with all the talk about at a US yield curve on its way to inversion, traders should also note that the previous two recessions were foretold by a surge in crude oil prices.
Future’s Spread Backwardation Shows Buying Pressure at 4-Year High
Time spreads of futures contracts are one of the purest ways to get a pulse on the demand to buy now or later. When a front-month contract trades at a premium to a later dated contract, known as backwardation, the implication is that the benefits to hold due to either supply shortage or increasing demand outweighs the costs to hold such as storage, insurance, etc.
Recently, the backwardation on the Brent December 2018-December 2019 contract traded to the strongest level in almost 4-years with the Dec. 2019-Dec. 2020 also showing an expanding backwardation as the market draws support from geopolitical risks and OPEC-led supply cuts.
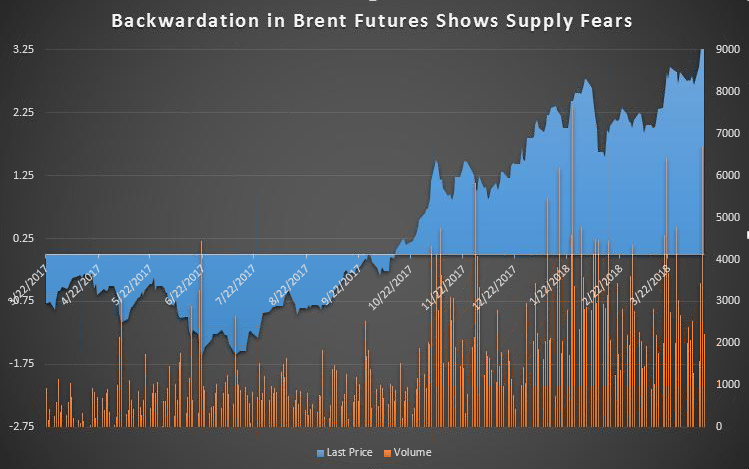
Data Source: Bloomberg, Chart created by Tyler Yell, CMT
There’s a global rise in oil demand! Click here to see our Q1 forecast on what outcomes we're watching!
Technical Focus for Crude Oil – Bullish Resumption despite Highest Level in 3 Yrs.

Chart Source: ProRealtime, IG UK Price Feed. Created by Tyler Yell, CMT
The technical focus on WTI Crude Oil remains bullish as WTI looks destined to test the 100% Fibonacci extension off the 2017 low at $70.16/bbl. Only a break below the supporting trendline would open up a likely test of the 200-DMA at ~$56/bbl.
Bears who continue to focus on some of the bearish fundamentals such as record-high US production and possibly slowing demand can keep an eye on Ichimoku (applied to the chart above) for evidence that a catalyst may have brought their views into play. For now, with the price above the Ichimoku cloud, WTI looks to have room for another leg up.
Learn how to utilize Ichimoku Cloud in our FREE guide here
If you want to see Ichimoku Analysis in action, check out my new report, Ichimoku Charts that Matter
Next Week’s Data Points That May Affect Energy Markets:
The fundamental focal points for the energy market next week:
- Monday: Kuwait Oil & Gas Summit, Kuwait City with speakers including OPEC Sec.-Gen. Barkindo
- Monday: EIA’s Monthly Drilling Productivity Report
- Tuesday 04:30 PM ET: API issues weekly US Oil Inventory report
- Wednesday 10:30 AM ET: EIA issues weekly US Oil Inventory Report
- Wednesday: JODI Issues World Oil exports, output data
- Thursday: API Monthly Statistical Report
- Thursday: OPEC’s Joint Technical Committee meets in Jeddah, Saudi Arabia
- Friday: OPEC’s Joint Ministerial Monitoring Committee meets in Jeddah, Saudi Arabia
- Friday 1:00 PM ET: Baker-Hughes Rig Count
- Friday 3:30 PM ET: Release of the CFTC weekly commitments of traders report on U.S. futures, options contracts
Crude Oil Insight from IG UK Client Sentiment: Contrarian view of retail positioning favors bullishness
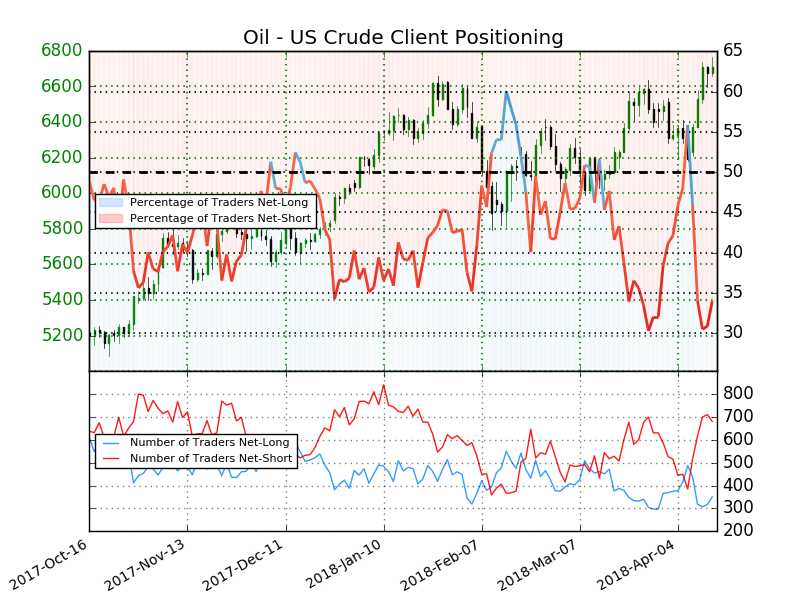
Source: IG UK Client Sentiment Readings on DailyFX
Oil - US Crude: Retail trader data shows 35.5% of traders are net-long with the ratio of traders short to long at 1.82 to 1. The number of traders net-long is 9.2% higher than yesterday and 10.2% lower from last week, while the number of traders net-short is 4.6% lower than yesterday and 36.0% higher from last week.
We typically take a contrarian view to crowd sentiment, and the fact traders are net-short suggests Oil - US Crude prices may continue to rise.
Discuss this or other markets you’re trading with me below!
---Written by Tyler Yell, CMT
Tyler Yell is a Chartered Market Technician. Tyler provides Technical analysis that is powered by fundamental factors on key markets as well as t1rading educational resources. Read more of Tyler’s Technical reports via his bio page.
Communicate with Tyler and have your shout below by posting in the comments area. Feel free to include your market views as well.
Discuss this market with Tyler in the live webinar, FX Closing Bell, Weekdays Monday-Thursday at 3 pm ET.
Talk markets on twitter @ForexYell
Join Tyler’s distribution list.


