


Talking Points:
- EUR/USD one-day & one-week implied volatility jump to a more than 2-week high
- An upcoming speech from ECB’s Mario Draghi as well as due German data loom
- Signs of a reversal in EUR/USD seem to be present, but confirmation is still needed
See how the Euro is viewed by the trading community at the DailyFX Sentiment Page.
Euro options-derived volatility is pointing to what could be more active price action in the week ahead. The 1-day (1D) implied volatility reading for EUR/USD stands at 10.08%. This is the highest since February 8th, more than two weeks ago. Meanwhile, the 1-week (1W) measurement has jumped from 7.15% on Friday to 9.62%. Also the most since February 8th. A week that is loaded with key Euro-zone economic data releases probably explains this.
Implied Volatility and Market Range

Looking at the next 24 hours, ECB’s President Mario Draghi will speak at the European Parliament in Brussels. The markets will probably be tuning in to see what he has to say about monetary policy given the recent central bank minutes. This report showed that some members wanted to drop the current bias towards easing.
Beyond that horizon, on Tuesday we will get German CPI. Economists are expecting the preliminary reading of the headline rate to fall to 1.5% y/y from 1.6%. The very next day, Germany will also release their employment statistics which will be followed by aggregate Euro-zone CPI readings. Now let us take a look where price action as a result of surprises in these may take us.
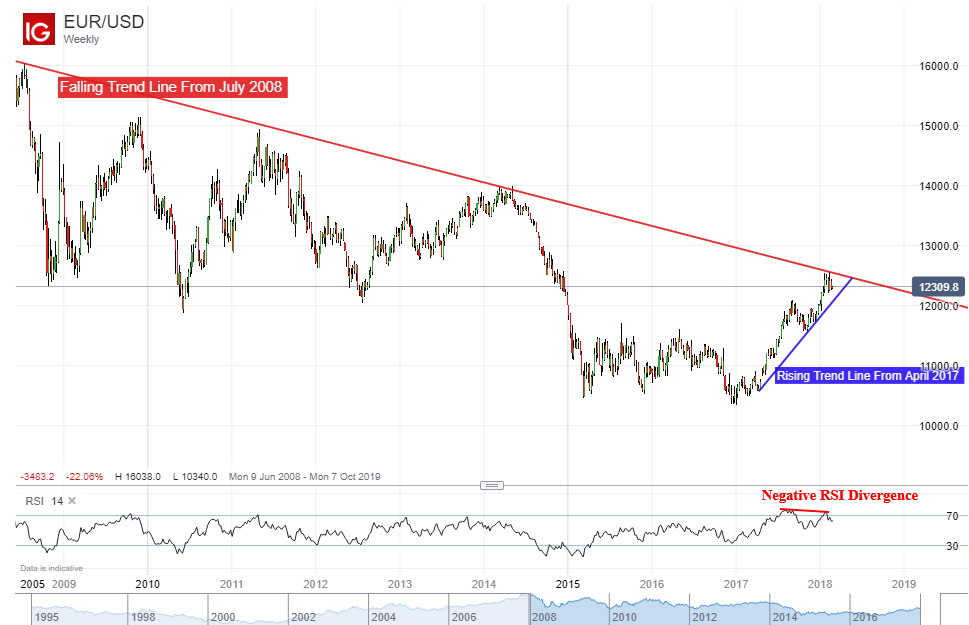
EUR/USD Technical Analysis: Double Top at Long-Term Falling Resistance?
On a daily chart, EUR/USD appears to be stuck above a near-term support line as indicated by the thinner blue line on the chart below. Prior to this, the currency pair formed what appears to be a double top on the falling long-term trend line that goes all the way back to July 2008. Simultaneously, negative RSI divergence popped up which indicated ebbing momentum. Confirmation of the double top is needed though via a break below rising support.
From here, the “day range high” at 1.2480 may stand in way as immediate resistance over the next 24 hours. A push above that will expose the “week range high” at 1.2480. While there is a 68 percent chance that prices may remain within that outer boundary, a break to the upside will have EUR/USD facing the stubborn long-term falling trend line from 2008.
On the other hand, the “day range low” at 1.2248 and the near-term rising line stand in the way as immediate support. A break below that will expose the 38.2% Fibonacci level at 1.2173 which also closely aligns with the “week range low”. Should EUR/USD fall beyond that, the rising trend line from April 2017 could be the next area of support.

On a weekly chart, you can get a closer view of the long-term falling and rising trend lines in EUR/USD. Notice that here too is negative RSI divergence present.
For other currency volatility-related articles please visit the Binaries page.


