


Talking Points:
- Oil Prices Vulnerable to Signs of Growing U.S. Crude Output.
- Crude Risks Larger Pullback as Oil Prices Initiate Bearish Sequence.
- Are you looking to improve your trading approach? Check out Traits of Successful Traders. And if you’re looking for trade ideas, check out our IG Client Sentiment.
Fundamental Forecast for Oil: Neutral
The aggressive bullish run that’s been seen in Oil prices over the past seven months softened this week in both WTI and Brent. This happens just a week after Oil prices hit a fresh three-year high, driven in large part by the production caps agreed upon by OPEC/Russia in the year-prior. Those caps were extended last year to the end of 2018, and that helped to reinvigorate the bullish move that’s continued into this year’s trading. But the entire time this has been happening, there was the growing concern around U.S. shale. The longer that prices remained elevated, the higher the incentive for continued development of shale extraction which, eventually, could challenge established players in the global oil market as additional supplies came online.
Some context was added behind this when earlier this week it was announced that the United States crossed the 10 million barrel-per-day (bpd) marker for January. On Wednesday, EIA data showed that U.S. production rose by 384,000 bpd to average 10.038 million bpd in the month of January. This is the highest output from the United States since all the way back to November of 1970 when a record was set at 10.044m/bpd. This 10 million number is a big deal, as it puts the United States on par with the production of Oil giant Saudi Arabia and is eclipsed only by that of Russia, who put in an average of 10.98 million barrels per day last year. This also presents a quandary for OPEC and countries who derive a vast portion of their economic activity from fossil fuels: There’s a new major supplier in the market, and price controls from OPEC grow weaker as US production continues to scale-higher.
WTI Crude Oil Hourly Chart: Lower-Highs After Recovery From Early-Week Sell-Off
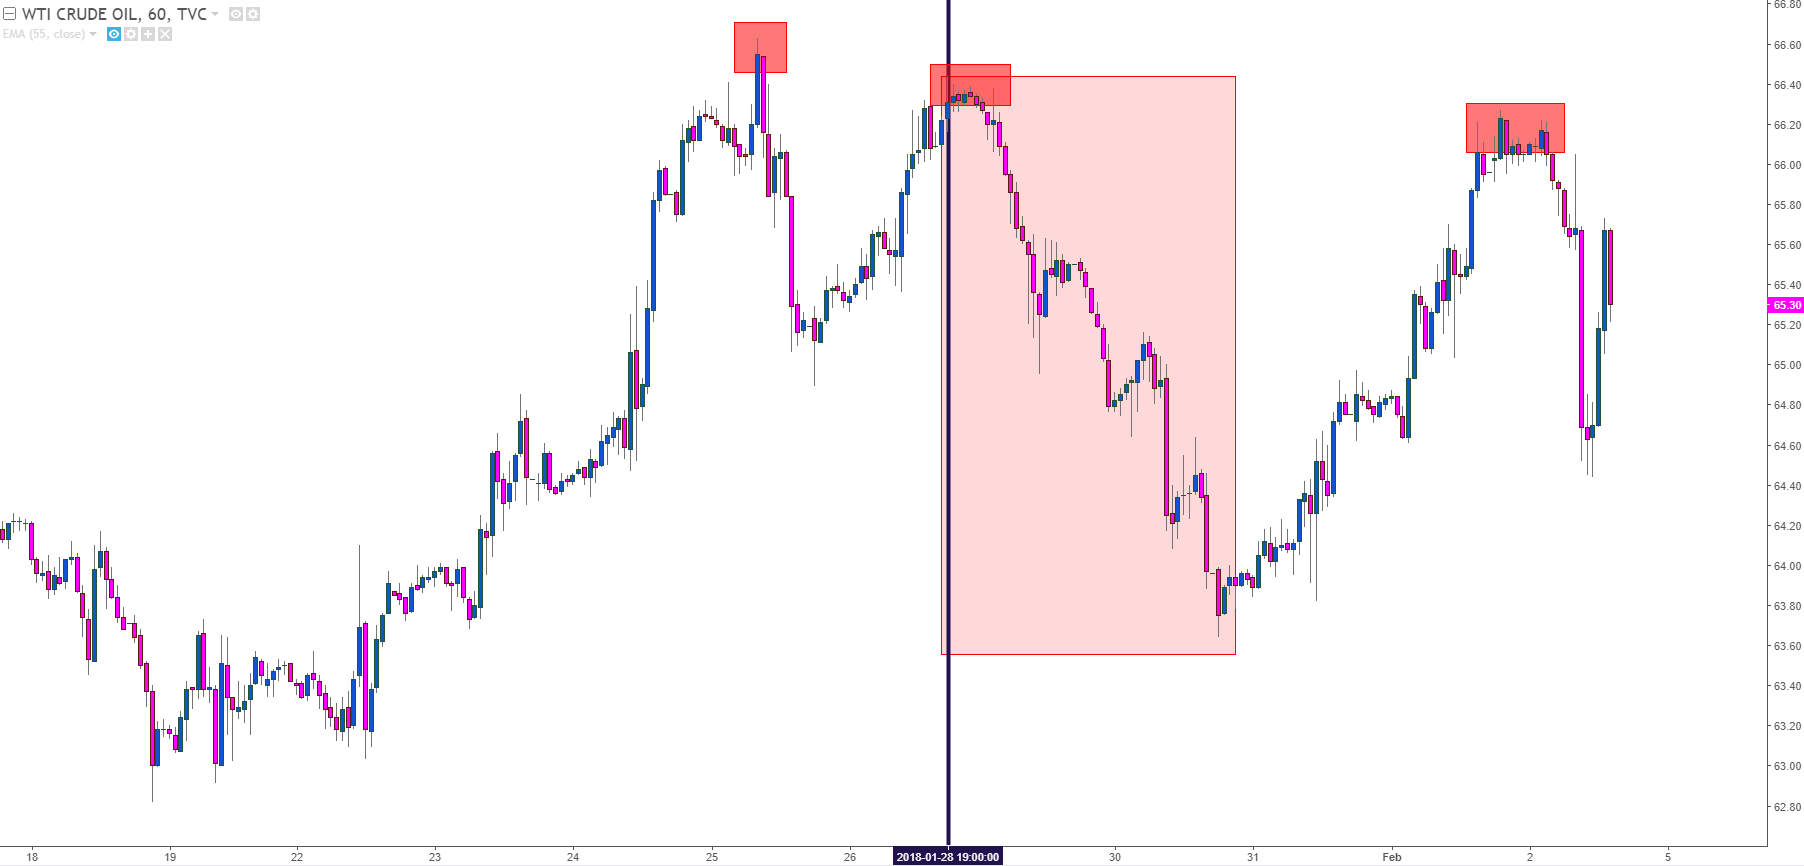
Chart prepared by James Stanley
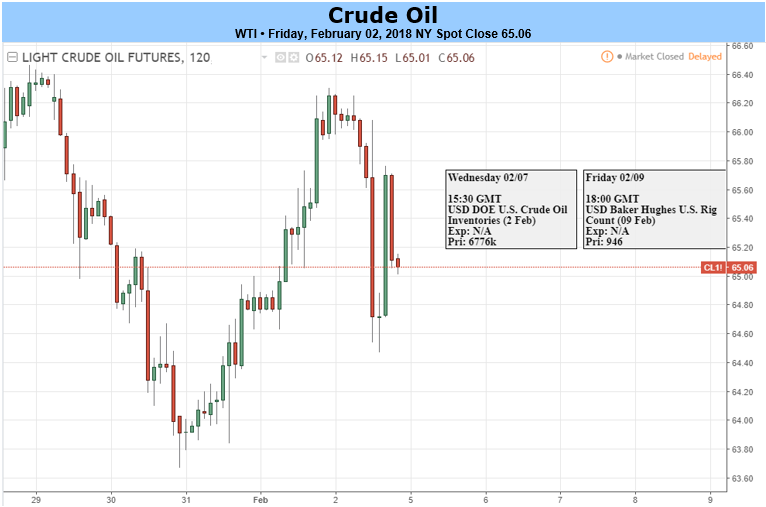
Oil prices started this week with sell-offs on Monday and Tuesday after hitting a fresh three-year high last Thursday. A large chunk of that sell-off was reclaimed by price action on Wednesday and Thursday after Oil had went into backwardation; where front end Oil prices are higher than future delivery, indicating that near-term demand is outstripping supply. A portion of those mid-week gains were given back on Friday as another negative factor began to show, which was strength in the U.S. Dollar. Given that Oil is quoted and traded in U.S. Dollars, a rise in the U.S. currency is a direct hit to Oil prices. Dollar strength hasn’t been much of a concern over the past year, and the continued weakness in the Greenback has surely been a positive factor for Oil prices. The big question is whether that weakness can continue after USD moved into a deeply oversold state last Thursday and started to establish a bit of support this week.
The forecast for Oil prices will be set to neutral for the week ahead. While the longer-term bullish trend remains intact, potential threats to the move have continued to avail themselves with the big focal point in the near-term being performance in the U.S. Dollar. And while this could eventually amount to a reversal of the bullish trend, evidence does not yet exist to support that thesis on a longer-term basis.
--- Written by James Stanley, Strategist for DailyFX.com
To receive James Stanley’s analysis directly via email, please SIGN UP HERE
Contact and follow James on Twitter: @JStanleyFX


