


Fundamental Forecast for USOIL: Bullish
Talking Points:
- OPEC and strategic alliances agree to extend production cuts to end of ’18 from March 18
- Strong trend shows struggles around $64.65 (Brent), $59 (WTI)
- Per BHI, U.S. Oil Rig Count rises 2 to 749, third rise in four weeks
- IGCS showing net-short retail positioning in WTI - US Oil, market has traded 12% higher since signal emerged
As OPEC and Russia agreed to extend production curbs to the end of 2018, traders appeared to lose interest in aggressively chasing the short side. On mid-Friday, after the production curb extension was curbed, both WTI Crude and the global benchmark, Brent Oil traded near their highest levels of the year at $58.50 and ~$64 per barrel respectively. One component of the crude market that is not in a bull market is oil volatility.
In much the same manner that central banks have worked to suppress volatility by over guiding future expectations, OPEC seems to be playing the same card. Multiple volatility gauges in the Crude Oil market fell to a 3-year low, which is a derivative of OPEC success. In short, Oil volatility is synonymous with downside price shocks and is painful to producers globally. Therefore, rising Oil prices with WTI near the highest levels since 2015 alongside the lowest volatility in three-years with technology reducing the cost per barrel of production is a bit of a Goldilocks scenario.
Following the lead of volatility, it appears that oil, like other asset classes, will have fewer aggressive price shocks going forward as OPEC fulfills its mission to normalize global inventory levels that should reduce the risk of unexpected supply builds. While the alpha might be hard to grab in Oil, there is likely little to be gained from a naked short position in the energy market.
There’s a global rise in oil demand! Click here to see our Q4 forecast on what outcomes we're watching!
Now, on to the charts. Earlier, we mentioned that volatility is continually slipping. While volatility is mean-reverting, the trend is lower, and low volatility tends to favor slower and steadier rises.
Recently, the price of WTI Crude (US oil) has settled the week above the 200-week moving average, the first time since 2014. Current resistance is found at the 1.618% Fibonacci extension and the November high at $59.08. Beyond $59.08, traders should look to the 2015 high of $62.58. A breakdown of price would likely first find support at the mid-November inter-day low ($54.89) followed by the September high ($52.86.) A hold and reversal higher from here would turn sights back to the 2015 high at $62.58 whereas a close below $52.86 could see a test of the October low at $49.10. The former bullish view is favored.
Crude Oil price moves to key resistance at $59.08 and looks to close above the 200-WMA ($58.18)
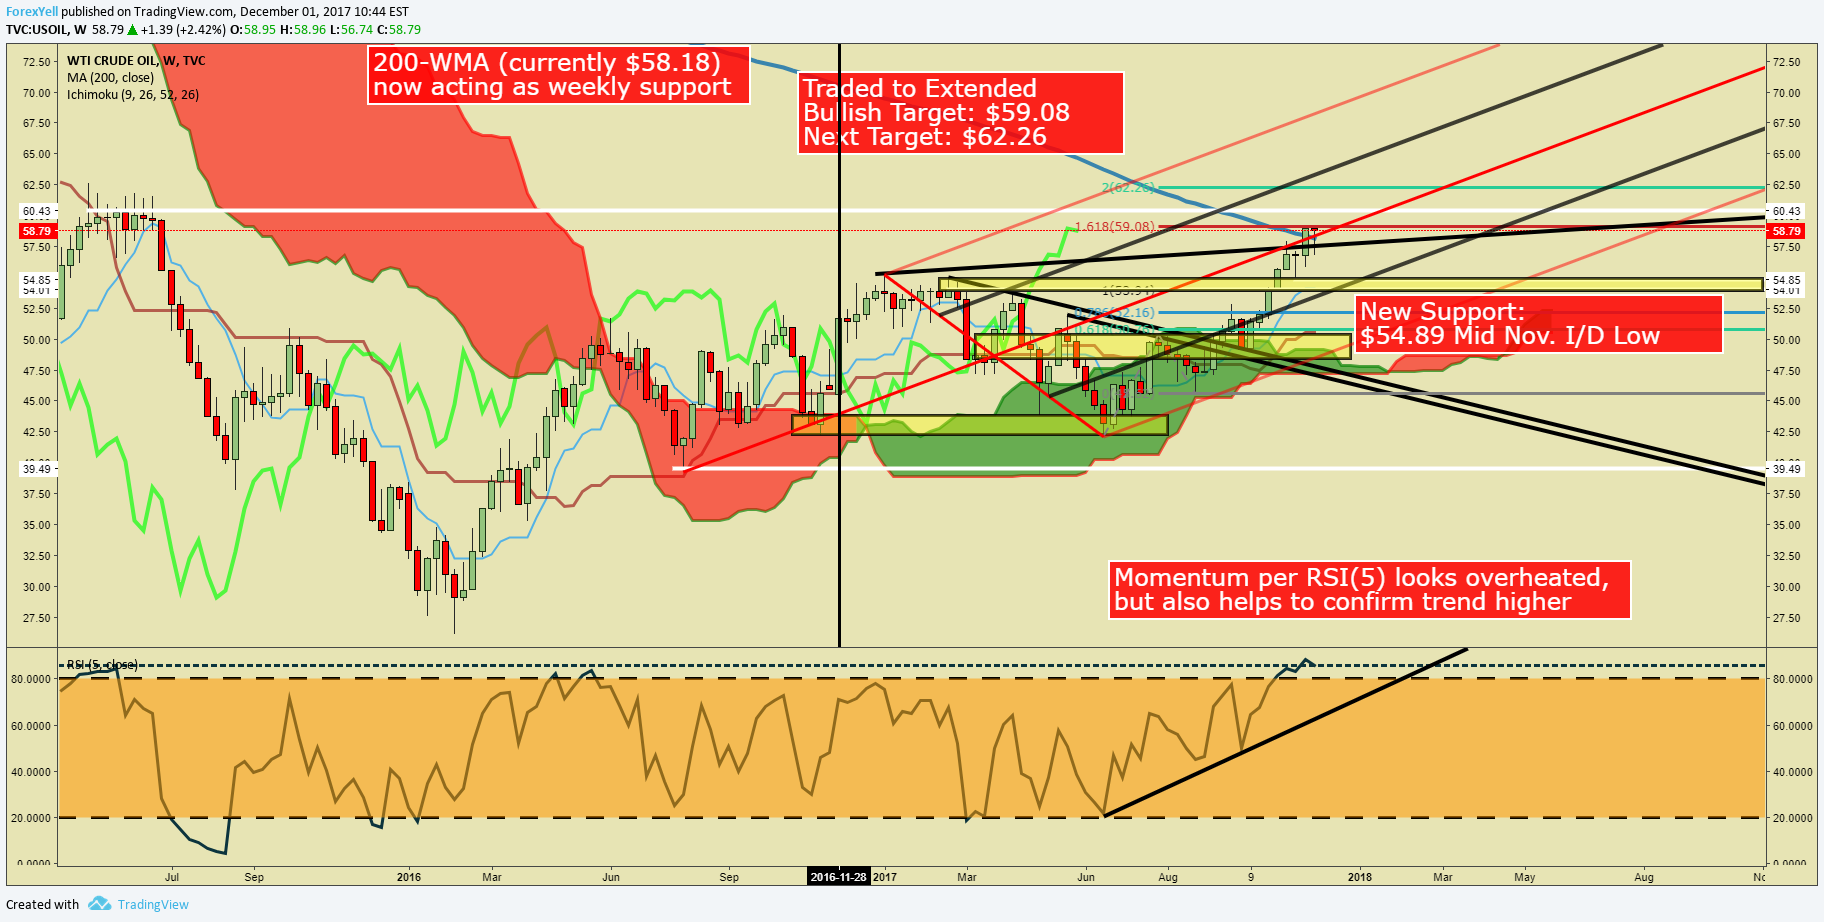
Chart Created by Tyler Yell, CMT
Next Week’s Data Points That May Affect Energy Markets:
The fundamental focal points for the energy market next week:
- Tuesday 8:30 AM ET: Census bureau releases crude export data through October 2017
- Tuesday 4:30 PM ET: API issues weekly U.S. oil inventory forecast
- Wednesday, time uncertain: ICIS China’s 14th China International Petroleum Industry Annual Conference in Guangzhou
- Wednesday 10:30 AM ET: EIA weekly US Oil Inventory Report
- Thursday, All Day: S&P Platts Global Energy Outlook Forum, New York
- Fridays 1:00 PM ET: Baker-Hughes Rig Count at
- Friday 3:30 PM ET: Release of the CFTC weekly commitments of traders report on U.S. futures, options contracts
Crude Oil IG Client Sentiment Highlight: Contrarian view of retail positioning favors upside

Oil - US Crude: Retail trader data shows 46.7% of traders are net-long with the ratio of traders short to long at 1.14 to 1. In fact, traders have remained net-short since Oct 25 when Oil - US Crude traded near 5210.9; the price has moved 12.3% higher since then. The number of traders net-long is 7.5% higher than yesterday and 10.2% higher from last week, while the number of traders net-short is 4.0% lower than yesterday and 18.0% lower from last week.
We typically take a contrarian view to crowd sentiment, and the fact traders are net-short suggests Oil - US Crude prices may continue to rise. Yet traders are less net-short than yesterday and compared with last week. Recent changes in sentiment warn that the current Oil - US Crude price trend may soon reverse lower despite the fact traders remain net-short (emphasis added).
-TY


