


Talking Points:
- S&P 500: Pulls back on news of delayed tax cuts, bulls buy the dip, retain support.
- Nikkei sinks after running into a key Fibonacci level shortly after setting fresh 25-year highs.
- DAX had a rough week, with a -3.14% pullback from the Tuesday high to the Thursday low.
- FTSE weekly showed a bearish engulfing setup after a recent failure at resistance.
What can traders look for as we move into year-end? Click here for full access to the DailyFX Q4 Forecasts.
Global equities started this week on a bullish note, as has become par for the course of recent. But circulating reports on Thursday indicating that the US tax cuts that have become a significant driver of that move may not come into effect until 2019. This raises a whole host of questions, key of which is American political leadership and direction at next year’s mid-term elections. If tax cuts do not go through as planned, many expect Republicans to face a significantly more difficult battle in those crucial Congressional elections set to take place just about one year from now. This can also carry a significant bearing on near-term price action in the U.S. Dollar.
As those reports began to percolate through markets, a bit of risk aversion began to show across many global equity indices. But that risk aversion was rather short-lived in the S&P 500, where buyers came back ahead of the Thursday close and continued to support prices in early trade on Friday. The big item on the calendar for US markets next week is a pair of releases on Wednesday morning. This is when we’ll get October CPI and US Retail Sales, each of which will be closely watched in the effort of gauging just how hawkish the bank might be in 2018 (a December hike is almost a foregone conclusion at this point per markets, showing a current 100% probability per CME Fedwatch).
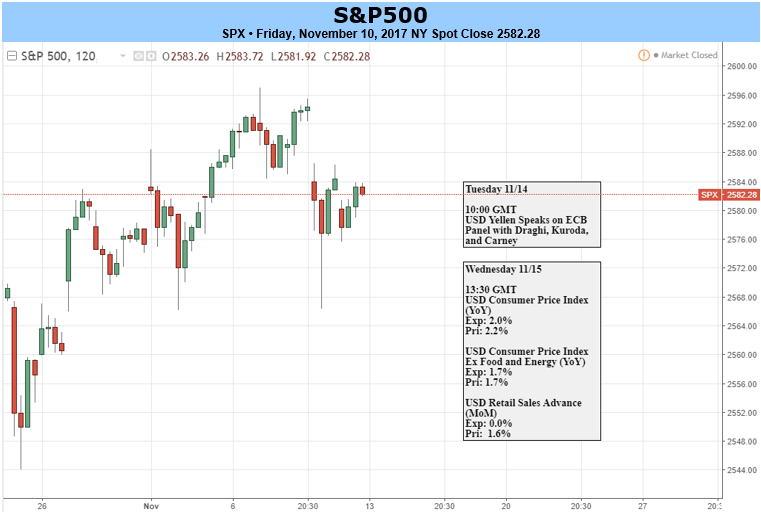
S&P 500
Given the reaction to the Thursday pullback, it would appear as though ‘buy the dip’ is alive and well here. That Thursday spill saw prices run down to the same swing-low that was set a week earlier at 2,566, at which point buyers showed-up to drive prices higher into the close. The Thursday daily bar ended up as a long-legged Dragonfly Doji after what had appeared to be an aggressive sell-off earlier in the session. Given the gap-lower on Thursday, some unfilled gap remains between the Wednesday close and the Thursday high, between 2,586-2,594. This area could become attractive for topside targets in the early portion of next week, provided that the swing-low at 2,566 remains respected.
The forecast on the S&P 500 will remain at bullish for next week.
S&P 500 Daily: Elevated (nothing new), Still Supported
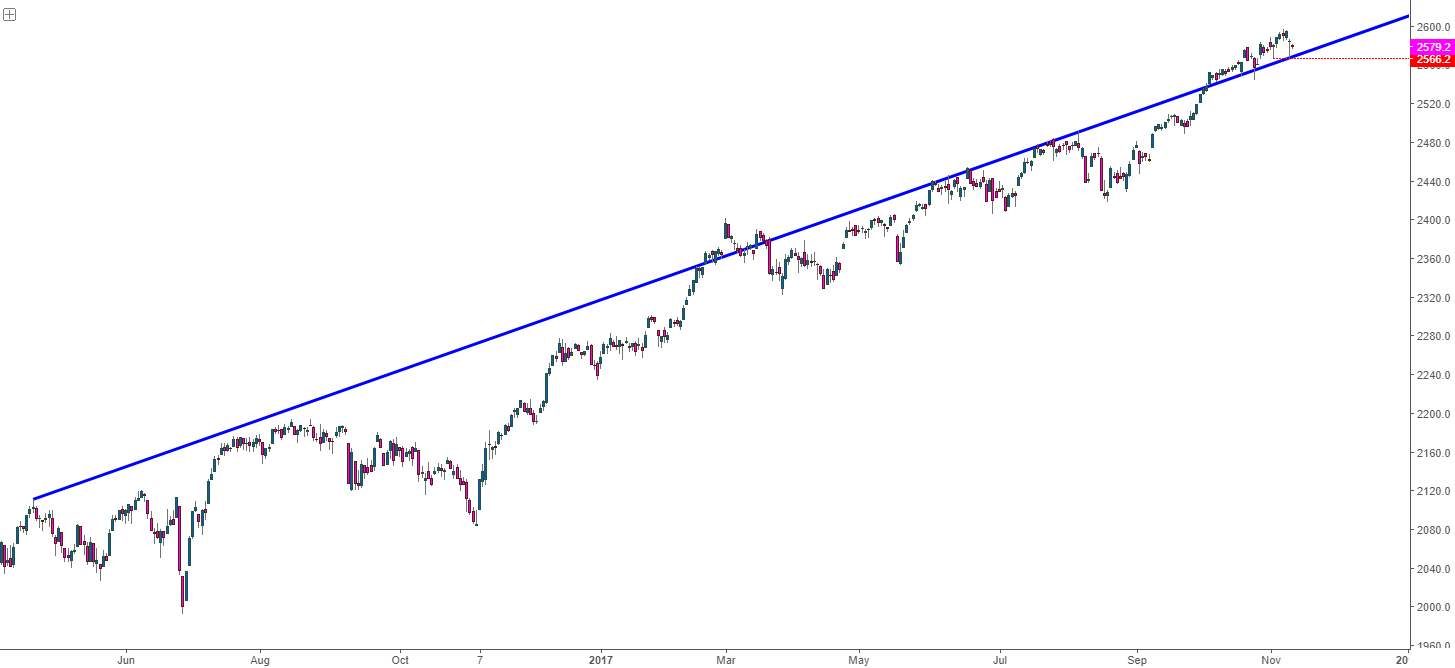
Chart prepared by James Stanley
Nikkei
The Nikkei has been red-hot over the past two months, adding a full 21.5% from the September 6th low up to yesterday’s high. The ignition of this move appears to be driven by a couple of different factors. 1) An even more dovish BoJ and 2 ) the recent Japanese elections that provided Prime Minister Shizo Abe with another nod of confidence, de facto endorsing the ‘three arrows’ approach towards Japanese economics.
Collectively, these drives have accounted for fresh 25-year highs in the Nikkei, with prices running into the 50% retracement of the 1990 top down to the 2008 bottom, and this is the first time that’s ever happened. Prices first ran into this level on Tuesday, at which point selling began to show. That happened again on Wednesday, and on Thursday sellers finally got the ammunition they were looking for on those reports around tax cuts, and prices turned-around in the most aggressive sell-off seen in the Nikkei in over two months.
Next week’s calendar contains one significant item of Japanese data with the release of 3rd quarter GDP figures. Perhaps more telling for price action - we get a couple of public appearances from BoJ Governor, Haruhiko Kuroda. Mr. Kuroda speaks in Zurich on Monday evening, and he then takes part in an ECB panel with FOMC Chair Janet Yellen and ECB President Mario Draghi the following morning. Nikkei bulls will likely be looking for any additional signs of dovishness from Mr. Kuroda.
The forecast for the Nikkei will be set to neutral for the week ahead. While the trend has been aggressively bullish, price interacting with a key resistance level after a monumental leap over the past two months raises a litany of questions around continuation potential at current prices.
Nikkei Fresh 25-Year Highs Run into Fibonacci Resistance
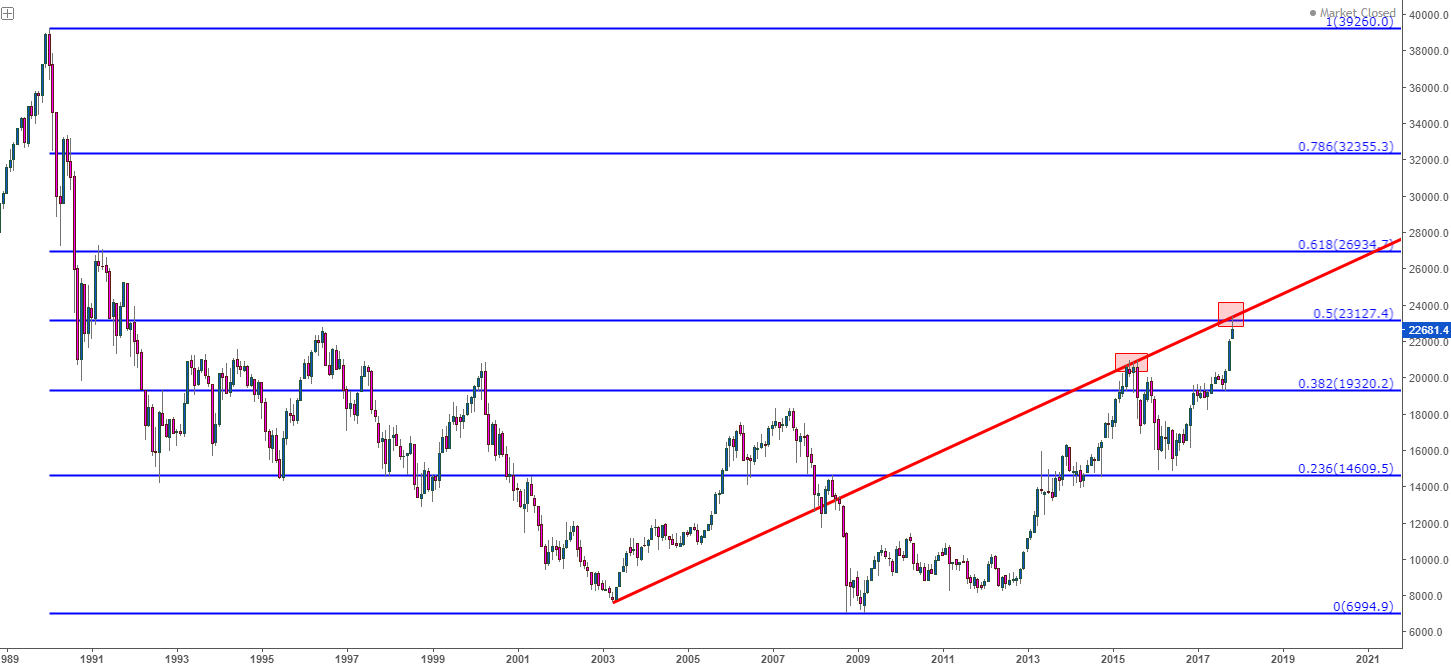
Chart prepared by James Stanley
DAX
German stocks had a rough week. After opening around those fresh all-time highs that were set last Friday, selling pressure showed-up to drive prices down by -3.14% from the Tuesday high to the Thursday low. This selling showed shortly after a disappointing print in industrial production figures indicated a deeper monthly contraction than was initially expected. And this seemingly showed-up as the Euro was putting in some form recovery after its recent spill, thereby continuing the relationship of European equity weakness on currency strength and vice-versa.
The big question on the DAX is whether buyers will show up to defend support around the prior support area around 12,925. This zone had held price action in the DAX for the bulk of October, and it appears as though we’re headed for another test there. But – will bulls be able to hold up the move this time as they did throughout most of last month?
This week closed as a bearish engulfing pattern on the DAX, and this may be pointing to bearish continuation against the trend of strength that’s shown over the past couple of months. We’re setting the forecast as neutral here as that bearish signal comes against the face of the bullish trend that’s shown of recent, but if support does show as indicated by a daily close within or around that zone, bullish positions can become favored under the drive of ‘buy the dip’. German GDP will likely be the focal point for next week, set to be released on Tuesday morning.
DAX Daily: Spills, but Can Bulls Defend Support/Prior Resistance?
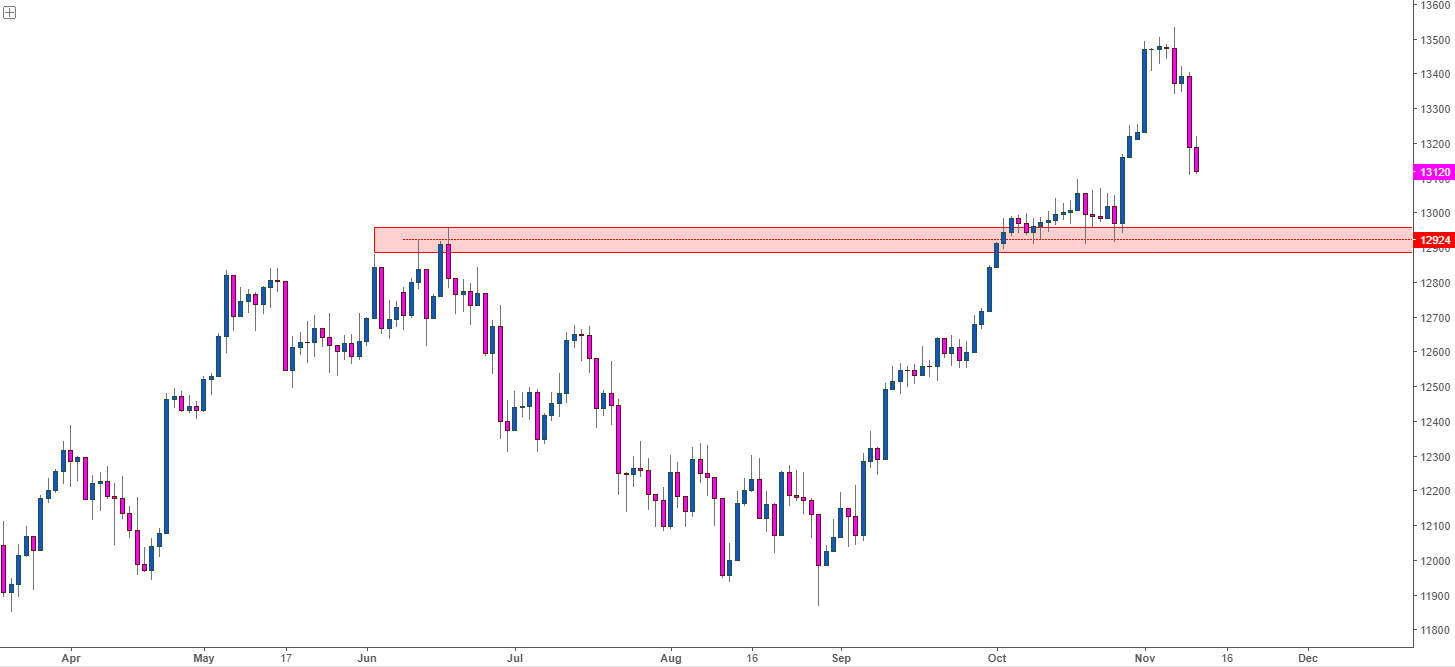
Chart prepared by James Stanley
FTSE 100
British stocks may be starting to open the door for short-side operations. The weekly bar showed as a bearish engulfing, and this takes place after prices were unable to break above the prior June high at 7598. So, this brings the backdrop of a bearish engulfing formation showing after a failure/lower-high. For those looking to take short equity stances, this can produce one of the most compelling current scenarios for such a theme; with the primary luxury being that risk levels can be controlled by placing stops above that grouping of prior highs.
The big item for the U.K. next week is CPI to be released on Tuesday morning. This has very much been a push point for the Bank of England, and this is what is largely responsible for that rate hike last week. If this data prints with strength, which could be considered for headline prints north of last month’s 3% marker, we will likely see some Sterling strength develop, which could spell trouble for the FTSE. For next week, the forecast will be set to bearish for UK equities.
FTSE 100 Weekly: Bearish Engulfing + Failure at High Exposes Deeper Support Levels

Chart prepared by James Stanley
--- Written by James Stanley, Strategist for DailyFX.com
To receive James Stanley’s analysis directly via email, please SIGN UP HERE
Contact and follow James on Twitter: @JStanleyFX


