


What’s inside:
- US Dollar Index (DXY) to continue rally from major support, euro to sink
- Gold poised to extend recent losses after break of support; Oil starts October at resistance, major pattern conflict on macro-front
- S&P 500 starts October off with a test, but has trend going for it (for now)
Trading psychology can’t be understated, check out our guide – Building Confidence in Trading.
US Dollar Index (DXY)
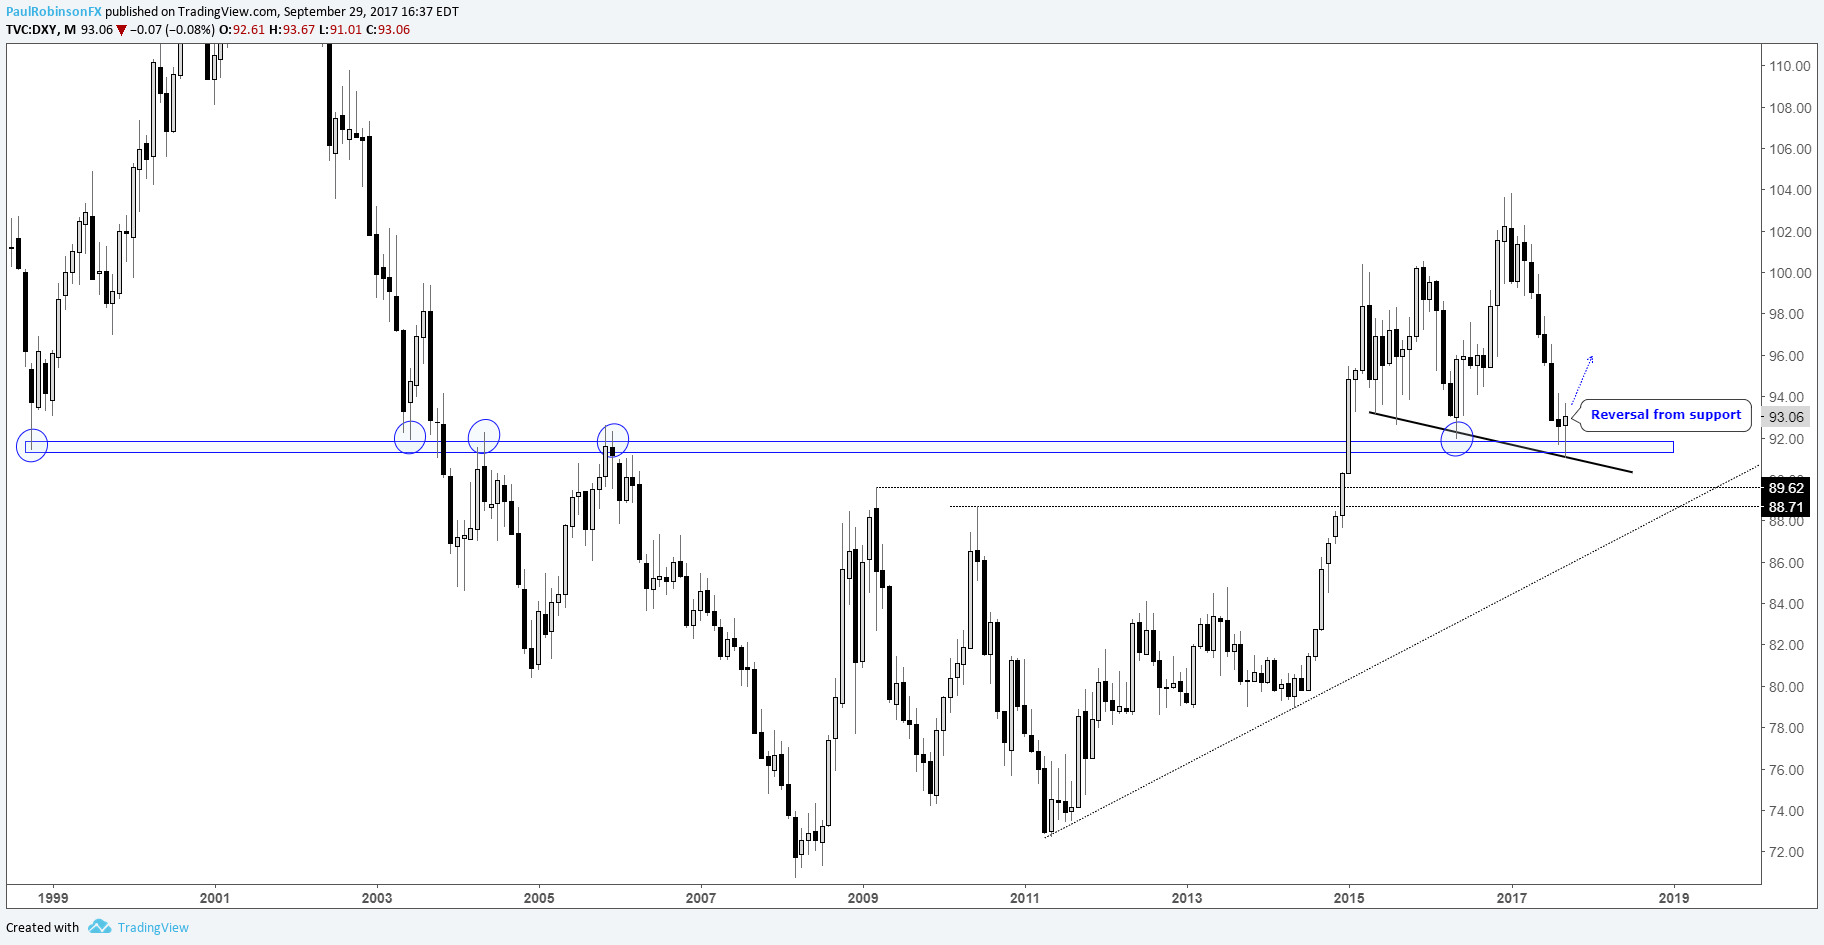
Last month, after six consecutive months of losses the DXY finally posted a positive month by putting in a semi-bullish monthly reversal-bar. Helping underpin the reversal is the fact that the bounce developed from a key area of long-term support, which actually began back as far as 1998. In confluence with this long-term inflection point is an underside trend-line running beneath lows since May 2015. The bounce may only prove to corrective in nature, but the stage is set for at least a bounce as we move into October and perhaps through the end of the year. Should we see a decline below the September low of 91.01, further dollar unravelling may be in order with peaks set in 2008 (89.62) and 2010 (88.71) as next up as important levels of support.
Check out the just released DailyFX Q4 Forecast for the US Dollar
US Dollar Index: Monthly
Join Paul on Tuesday for an in-depth discussion on global indices & commodities, for details see the Webinar Calendar.
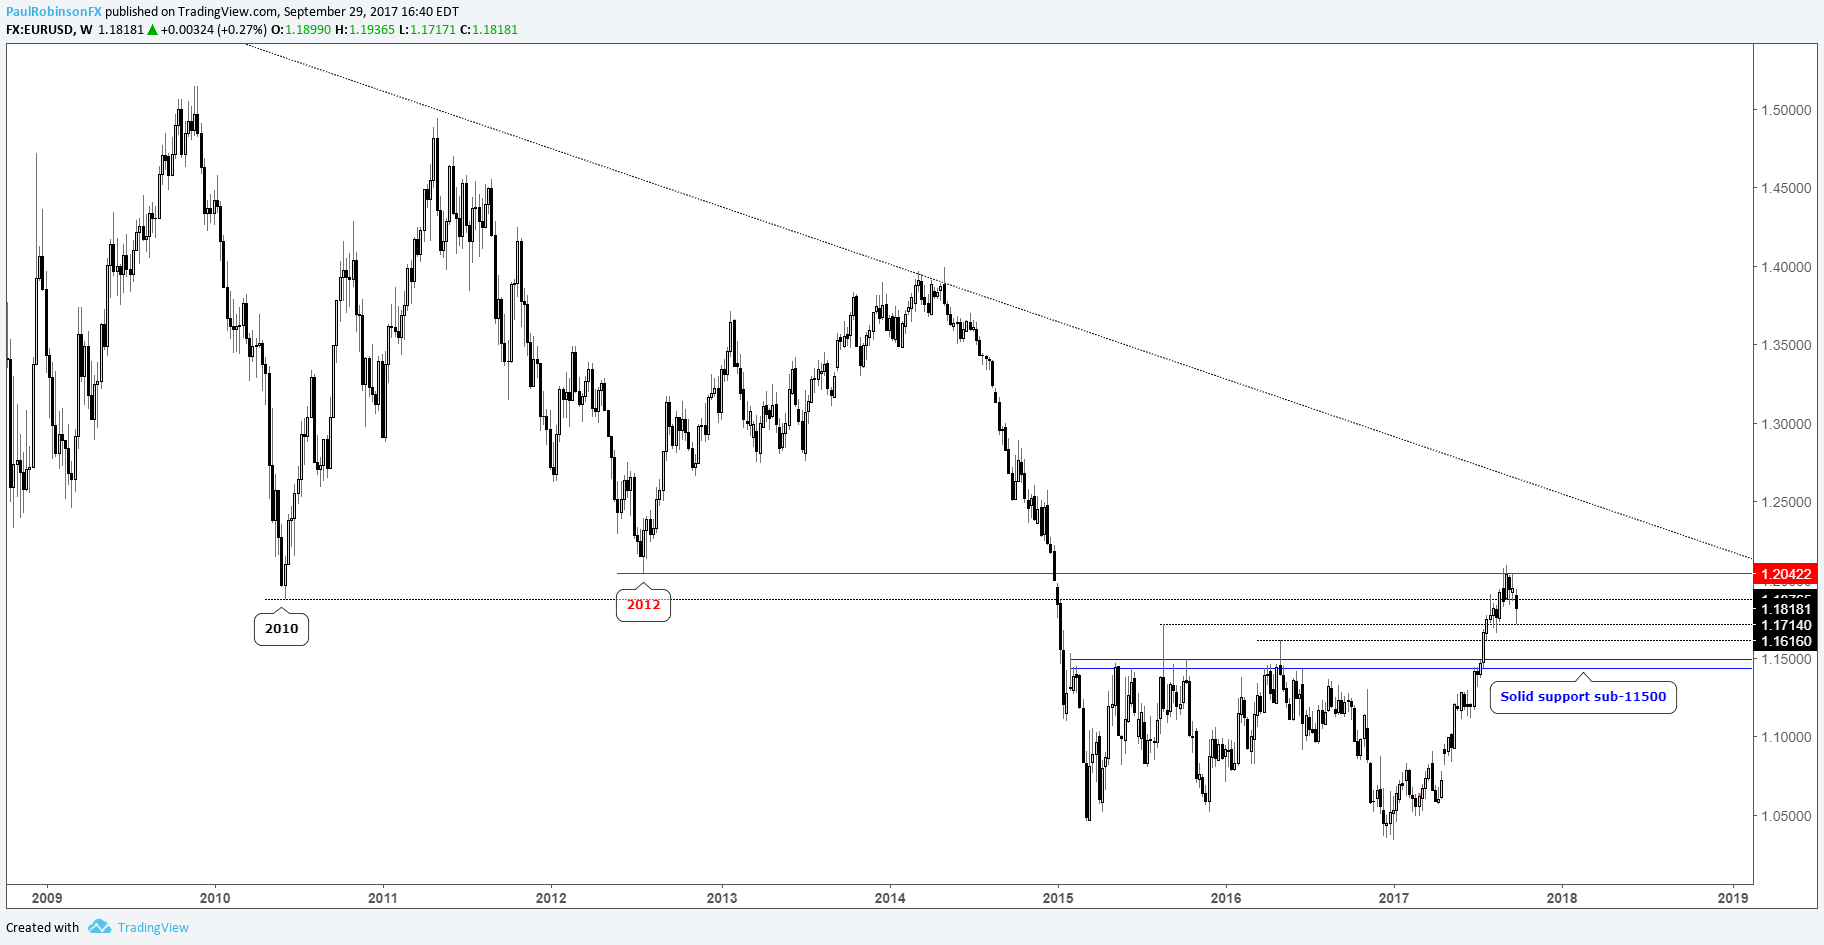
We’ve looked at the US Dollar Index, and with the euro accounting for approximately 57% of the index it is set up to go in reverse and take back some of its impressive rally this year. The 2010 low didn’t prove to be a significant turning point for the single-currency, but the 2012 low did as it reversed lower in similar fashion on the monthly as did the dollar off support.
Turning to the weekly chart, good support doesn’t arrive until in the 11400s. There are spike-highs at 11714 and 11616 arriving before then, but the bulk of weekly closes and high prints fall under the 11500 handle. A downward bias looks poised to benefit shorts for now, but with a thorough test of support in the weeks ahead a nice opportunity could be born for traders looking to establish longs.
EURUSD: Weekly
Check out the just released DailyFX Q4 Forecast for the Euro
Gold
In the past we’ve talked about the inverse correlation between gold and the dollar and how at times it can converge so as the two trade another. But those are generally short-lived aberrations before the two once again go their separate ways. With that said, when looking out over periods longer than a few weeks the negative correlation is typically reliable, and as such if the dollar is to undergo a meaningful rebound we are likely to see weakness in gold continue. Even on gold’s own technical merits it looks poised to decline further before finding meaningful support. Last week’s close below the double-tops from April/June at 1296 suggests a move towards the December trend-line in the 1240s is underway.
Trade below this t-line will likely lead to a retest of the 2011 trend-line. The crossing of this trend-line during the summer was an event that could have long-term bullish implications, and a retest before turning higher may be in order. If either of the aforementioned lines fail to provide support, then a move to 1205 and the December 2015 trend-line becomes the risk.
Looking higher, confluence between the September high and trend-line from August 2013 (~1360) will be a big test for gold. Looking beyond there the next targeted line of resistance will be the upper parallel tied to the December trend-line, which depending on the timing could align with the 2016 high at 1375.
Bottom line: There are a lot of levels/lines in close proximity to one another above and below current levels which could present attractive ‘decision points’ for traders.
Gold: Weekly

Check out the just released DailyFX Q4 Forecast for Gold
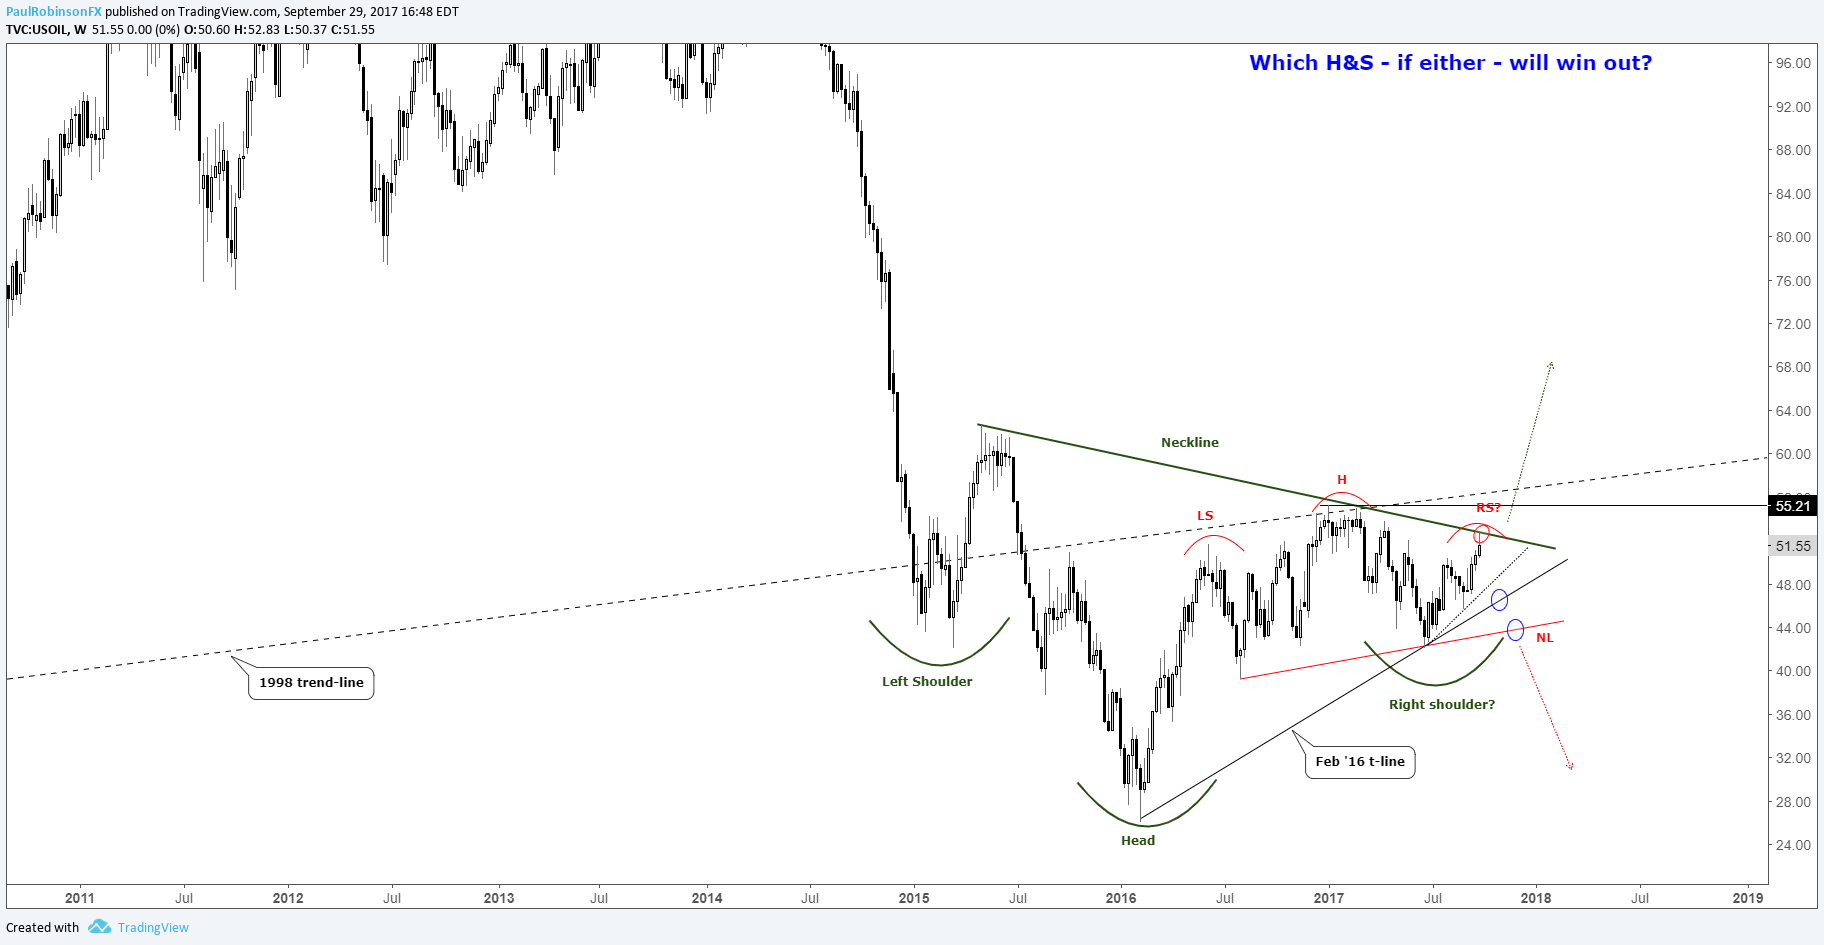
There is a battle going on between patterns of the same type but which point to very different outcomes. It is possible oil may be carving out a massive bottoming ‘head-and-shoulders’ pattern dating back to the development of the ‘right shoulder’ during early 2015. It’s also possible we are seeing a traditional ‘head-and-shoulders’ develop since a peak formed in June 2016. It just so happens that the neckline of the long-term bottoming H&S is also where the ‘right shoulder’ of the topping H&S could form. The trend-line off the May 2015 high (neckline) runs over the 2017 high and recently put a lid on oil last week, at least temporarily. We’ll first start off October with oil at resistance, but if it can firmly clear above then we could be seeing the beginning of a major move higher as the long-term bottoming formation is validated. There is the 2017 high just over 55 to contend with along with the 1998 trend-line, but the bottoming formation may be enough to send it through those levels. The depth of the pattern would call for a measured move target of ~85 – indeed a very bullish outcome. But before we get ahead of ourselves, we will start the new month at resistance and go from there.
If WTI turns lower from here, the February 2016 trend-line is the first line of support followed by the ‘neckline’ of the traditional H&S. It would require a weekly close below this threshold before we would have pattern validation, with a measured move target towards 30.
To be clear, a solid close beyond the neckline is required for either of these patterns to come into play, and there is the very real possibility oil continues to move sideways for an extended period of time negating both of these possibilities. But in the interim until we gain better clarity there are levels/lines to operate with.
Crude Oil: Weekly
Check out the just released DailyFX Q4 Forecast for Crude Oil
S&P 500
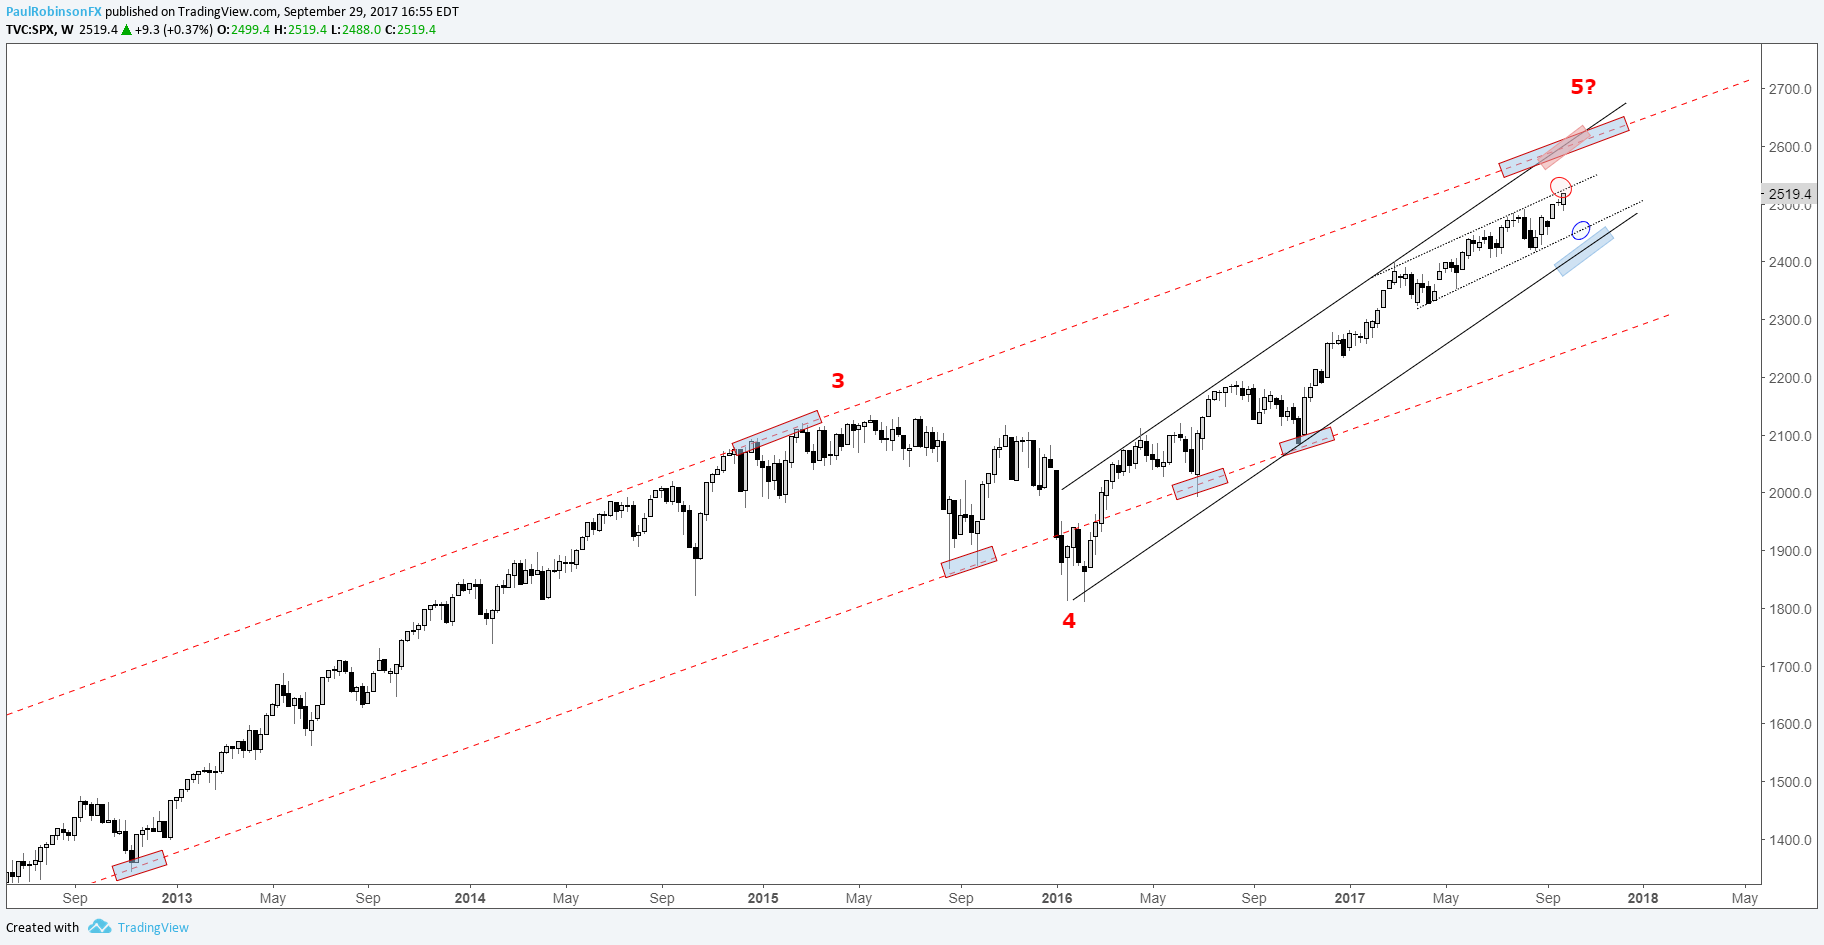
Looking long-term the S&P 500 appears to be in the 5th and final wave of a clear Elliot-wave cycle dating back to the 2009 low. (This was discussed in detail in a previous post in April.) That is the macro-view, but finding the top is a futile exercise and until price action begins validating the beginning of a bear market cycle we must continue to respect the trend. To start off October the S&P is right up near the top of a channel dating back to February, and will need to be crossed if the top of the February 2016 to current channel is to be seen. The upper parallel to this channel is in confluence with the upper parallel extending higher since all the way back to 2009. Confluence arrives around 2600, give or take 20 handles. That could become a very pivotal spot for the market. Giving the trend the benefit of the doubt, a subtle move to the lower parallel around 2450 may present a ‘buy-the-dip’ opportunity. Not far below there lies the very important trend-line off the Feb ’16 low, and a hold there is needed to keep the current 17+ month run intact.
S&P 500: Weekly
Check out the just released DailyFX Q4 Forecast for Equity Indices
---Written by Paul Robinson, Market Analyst
You can receive Paul’s analysis directly via email by signing up here.
You can follow Paul on Twitter at @PaulRobinonFX.


