


Talking Points:
- Both IEA & OPEC boost demand projections for global consumption favoring rebalance
- Worst case scenario of hurricanes averted, allowing refinery consumption to resume
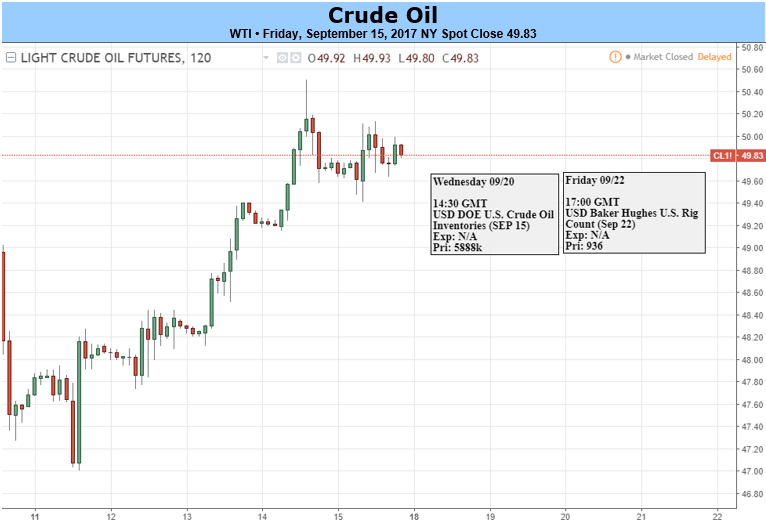
- Baker Hughes Data shows US Oil Rig Count Falls 7 to 749 active US oil rigs
- IGCS data showing US Crude client short positioning favors contrarian Bullish bias
Fundamental Forecast for Crude Oil: Neutral
The price action of Crude Oil gave it the biggest price rise since July. Such a bullish boost was not based on external factors like a weak USD or risk-sentiment shift, but rather by the strongest demand upgrade by the IEA since 2015. Naturally, hope is beginning to emerge that the rebalance efforts have proved worthwhile and could lead to balancing out the market and the purses of Oil producing nations and debt-laded E&P firms.
As of Friday morning, the gain for the week was around 5.1%. Beyond the upgraded demand forecasts from OPEC and the International Energy Agency, there is hope that when OPEC/Non-OPEC Joint Technical Committee and Joint Ministerial Monitoring Committee meet next Wednesday and Friday respectively that a decision could be reached to extend the production curbs into the second half of 2018.
A key focus this week was the wide spread between the bullish-looking Brent Oil chart and the uncertain crude oil market. Mid-week, the spread between the global benchmark (Brent) and Crude Oil, identical products produced in different parts of the world was the widest in two years. As the gap closed, Brent traded higher and reached the highest price since April when it traded at $55.74 in the Bullish aftermath of the IEA report showing the global oil surplus was shrinking.
Technical Outlook on Crude Oil: Still Resistance Keeps Technical Bias Lower
As the dust settles, it appears that a number of fundamental factors are aligning for the Oil Market that could continue to act as price support. The price of Crude topping $50 has not been a panacea for bullishness in the past as both recent attempts to trade above the 200-DMA did not hold more than a full week. If the stronger demand and ongoing supply restrictions hold, we could see gains that clearly take the market out of the 2017 downtrend.
The price support that traders should watch is not the 200-DMA at $49.56 that price is currently trading near, but the higher low of $47.08 from September 8. When looking at the chart above, you can see that the majority of price moves have been choppy and overlapping. This means that a break back below $47.08 would bring a continuation of the environment we’ve been trading in that is a multitude of three-wave moves that eventually move lower. Below $47.08 opens up the internal price support of $45.38, which has been a harbinger that Bearish Pressure was soon to reign supreme again. However, we don’t look to be near that environment and could, in fact, be working on the precipice of much stronger gains as explained through the eye of Elliott Wave analysis per our own, Jeremy Wagner, CEWA-M in his piece Crude Oil Prices Touch 6 Week High; More Strength to Follow?

Chart by Tyler Yell, CMT
Recommended Reading: Crude Oil Faces Pivotal Moment As IEA Sees Strong Oil-Demand Growth
Next Week’s Data Points That May Affect Energy Markets:
The fundamental focal points for the energy market next week:
- Monday 2:00 PM ET: EIA Monthly Drilling Productivity Report
- Monday (Time uncertain): JODI issues world oil exports, output data
- Tuesday 4:30 PM ET: API issues weekly U.S. oil inventory report
- Wednesday 2:00 PM ET: US Federal Reserve Interest Rate Decision
- Wednesday 10:30 AM ET: EIA Weekly U.S. Оil Inventory report
- Fridays 1:00 PM ET: Baker-Hughes Rig Count at
- Friday 3:30 PM ET: Release of the CFTC weekly commitments of traders report on U.S. futures, options contracts
- Friday (Time uncertain): OPEC/Non-OPEC Joint Ministerial Monitoring Committee
IGCS data showing US Crude client short positioning favors contrarian Bullish bias
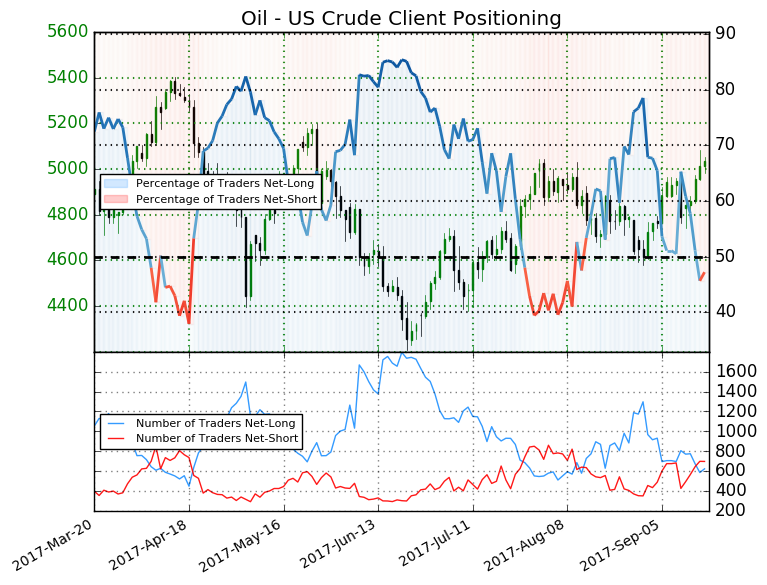
Oil - US Crude: Retail trader data shows 47.2% of traders are net-long with the ratio of traders short to long at 1.12 to 1. The number of traders net-long is 16.4% lower than yesterday and 11.5% lower from last week, while the number of traders net-short is 6.9% higher than yesterday and 4.0% higher from last week.
We typically take a contrarian view to crowd sentiment, and the fact traders are net-short suggests Oil - US Crude prices may continue to rise. Traders are further net-short than yesterday and last week, and the combination of current sentiment and recent changes gives us a stronger Oil - US Crude-bullish contrarian trading bias (emphasis added.)


