


Talking Points:
- Can the S&P 500 regain its footing in face of looming threats? (Chart suggest not)
- DAX continues to remain a global laggard, with little reasoning at this time to expect higher prices
- FTSE 100 goes from near record highs to potentially falling apart
Fundamental Forecast for equity indices: Bearish
S&P 500
The dominating theme next week will be how markets react to the heightened tensions between the U.S. and North Korea. We saw a bit of ‘risk-off’ last week, will we see more headlines impacting investor appetite for stocks in the week ahead? On the data-front, we have Advance Retail Sales for July on Tuesday and then the next ‘high’ impact data event isn’t until Friday when we get UofM Confidence for August. See the full economic calendar here.
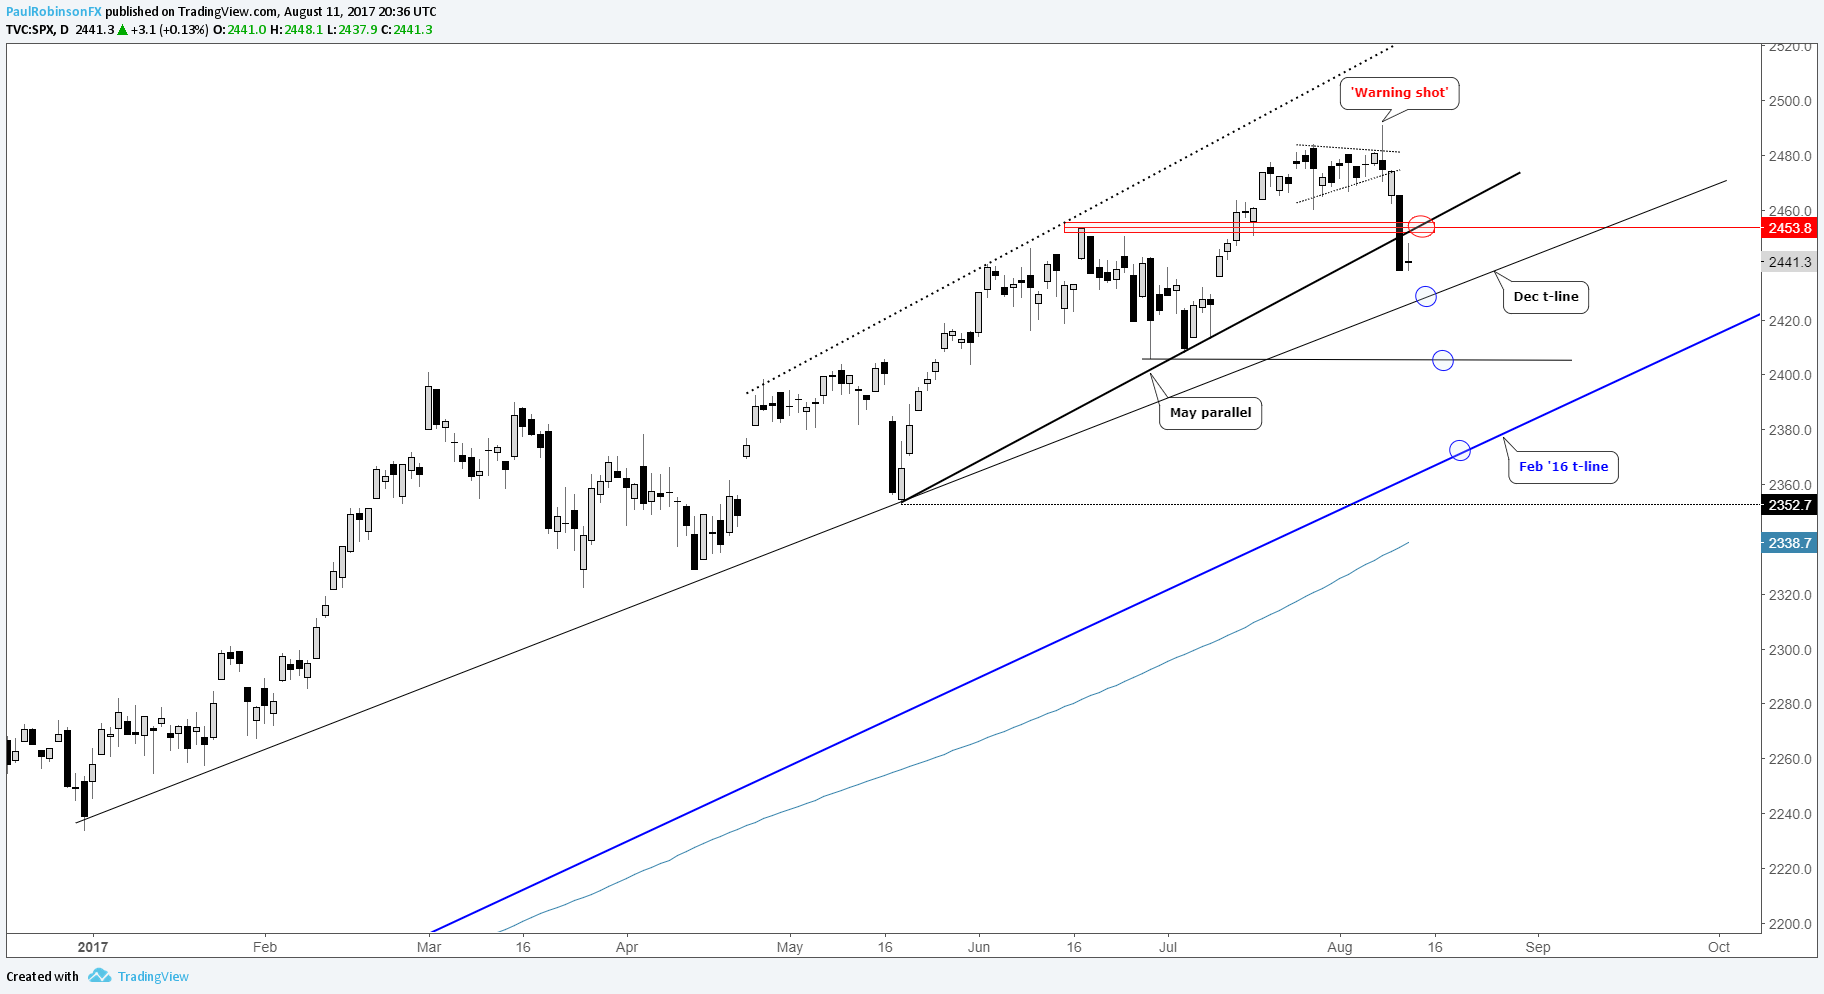
From a technical perspective, last week on Tuesday the market fired a warning shot when it put in a key reversal-day on an attempt to maintain new record levels. That reversal turned into a mini-rout on Thursday. The damage done was a break below the June high and lower parallel rising up from May. This keeps pressure on the market to try and regain a bullish posturing. It’s done so before (over and over in this ‘buy the dip’ market), but can it do it again – right now? The thinking on this end is more weakness before strength. The area right around 2450 will serve initially as resistance, and any failure to regain above is likely to lead to additional selling. The December trend-line around 2425 may provide some support, but if not look for a move towards the June low at 2405 to develop. If things get wild, the major trend-line rising up from the February 2016 low comes in about 65-70 handles lower from Friday’s close.
S&P 500: Daily
What will drive global stock markets this quarter? Check out our Q3 Forecasts!
DAX
Looking ahead to next week, the economic calendar holds a few things on the docket which market participants will key in on in addition to generally weak risk trends. On Tuesday, preliminary German 2Q GDP is due out, Wednesday brings Eurozone 2Q GDP, and then on Thursday the minutes from the July ECB meeting. Watch how any large reactions which may arise in the euro impacts German stocks.
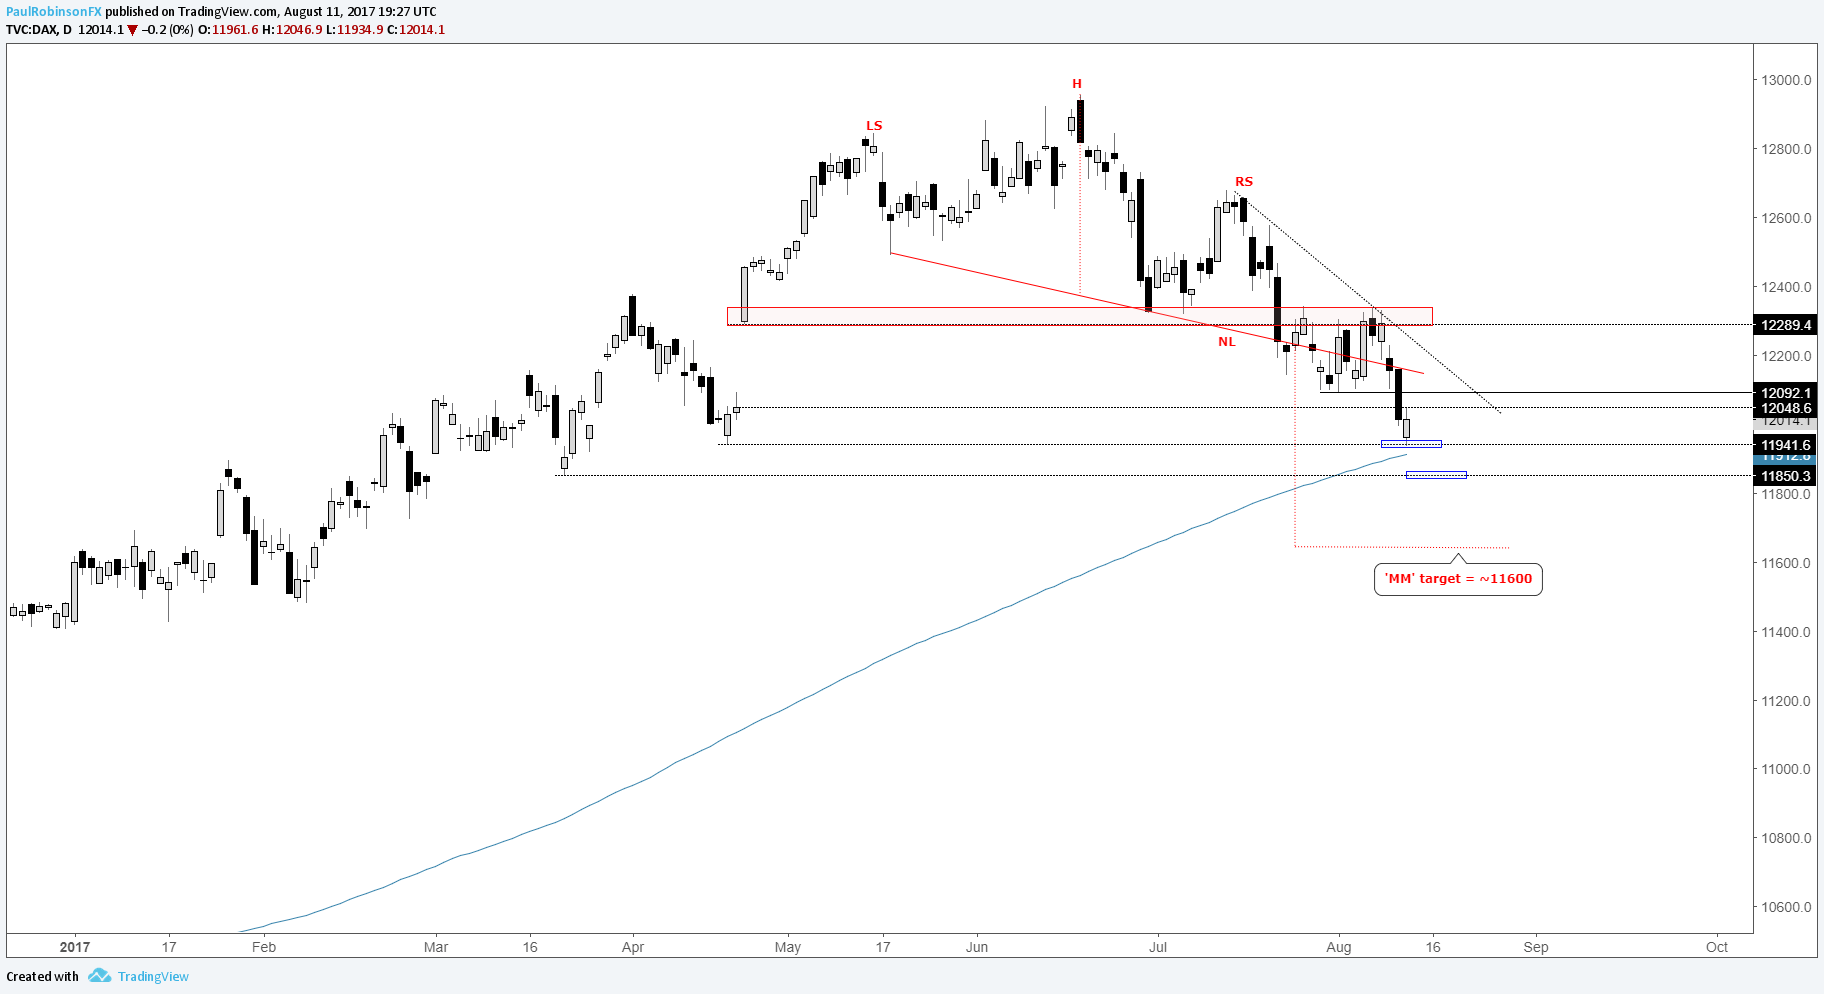
The DAX continues to lead major global indices lower with the strength of the euro as a key culprit, even though this past week the single-currency tried to ease off a bit. The ‘head-and-shoulders’ pattern we’ve been focused on is still in full-swing, but there are support levels along the way which could keep the market bouncing along on its way lower if we don’t see a full-blown ‘risk-off’ style sell-off in global equities. Friday, we saw support come in around the April swing-low at 11941. Beneath there lies the 200-day at 11912 and rising, along with a swing-low created in March at 11850. The measured move target of the H&S topping pattern arrives near 11600. At this time, it will be difficult to turn the picture bullish unless perhaps we see some type of price action marking a capitulation low; but that would of course still require a strong move down first. Overall, the path of least resistance continues in favor of sellers.
DAX: Daily
FTSE 100
The only ‘high’ impact data event scheduled is the release of UK CPI data on Tuesday. The economic calendar otherwise is relatively light in terms of UK data outside of employment figures on Wednesday. As is the case in general, market participants will be closely watching risk trends as market jitters over the North Korean situation continues to keep everyone’s attention.
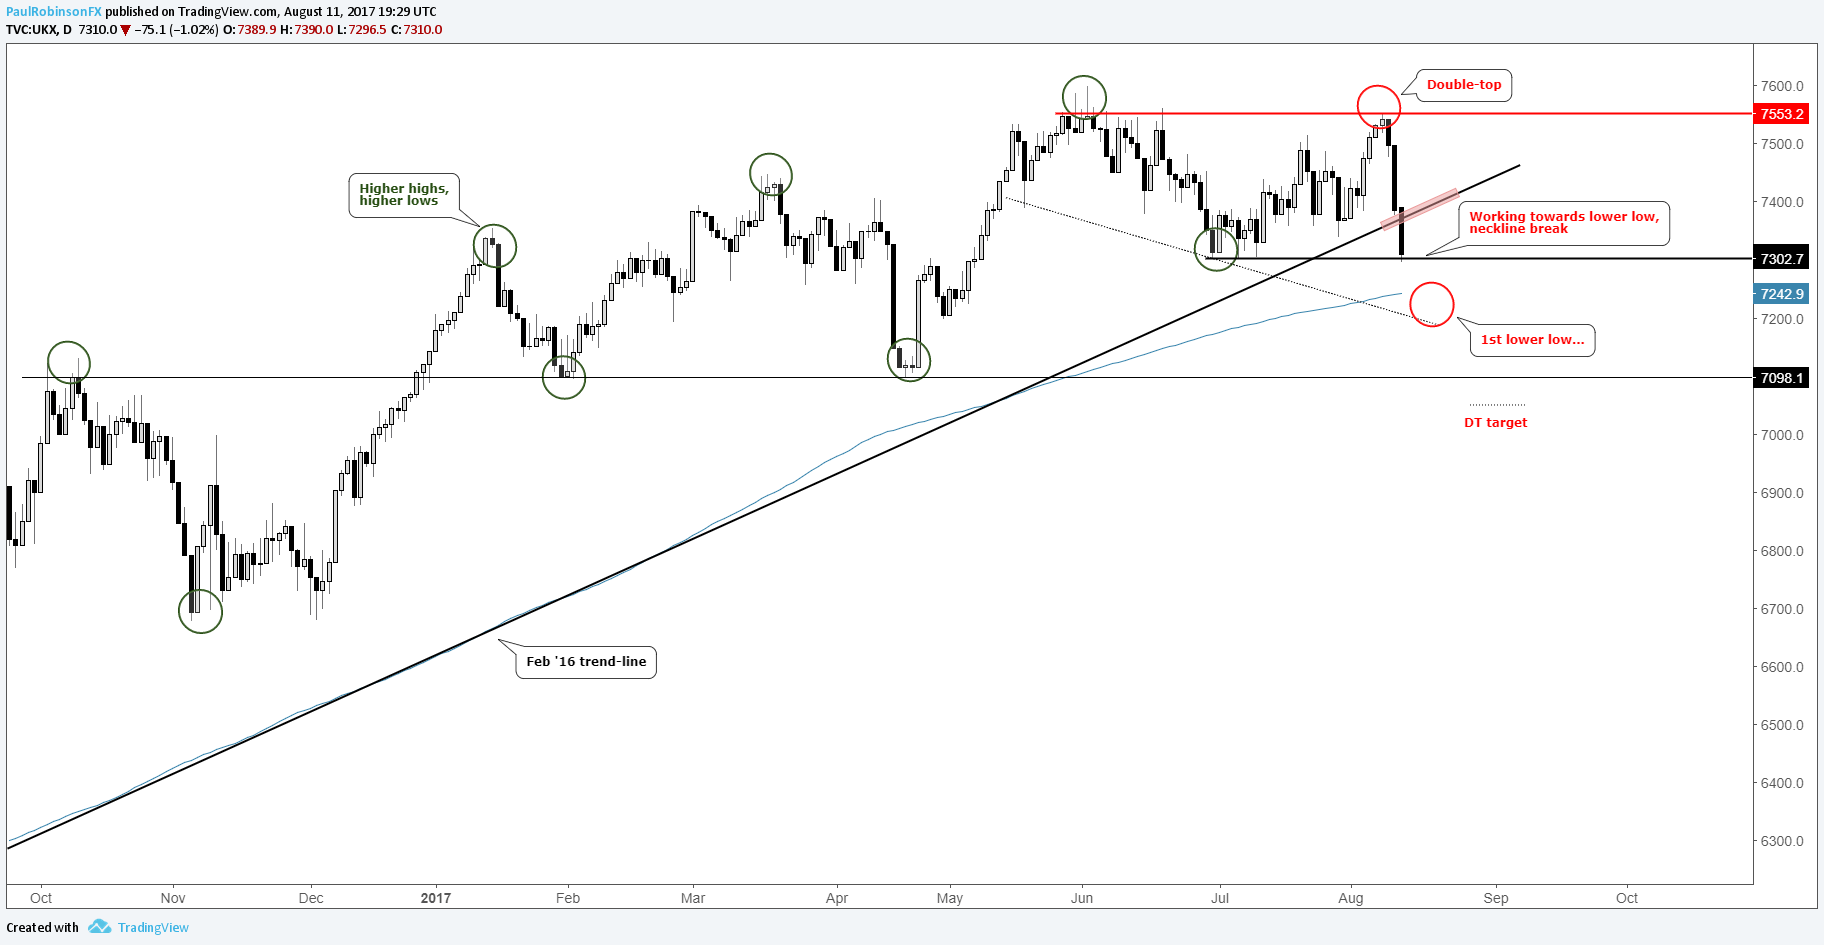
The evidence of ‘risk-off’ couldn’t have been much more prevalent than what we witnessed in the footsie last week. The UK index went from nearly posting a new record high to closing on the neckline of what is now looking like a solid double-top formation. The market closed the week right at neckline support dating back to late-June, early-July. Since global markets put in a major low back in February 2016, the FTSE has maintained a trend of higher highs and higher lows. But that could change this coming week. A clean break below 7300 will mark a break in the bullish sequence and trigger the double-top formation. Also furthering a bearish bias is the fact the trend-line rising up from that February low was clearly broken on Friday. The double-top measured move target (based on the height of the formation) points to ~7050. There could be stops along the way if we are to see a continued swoon, with the first one below 7300 coming in at the 200-day at 7243, then the 7100-mark which has been a big level since October. A hold of 7300 may provide a bounce, but look for it to struggle on a retest of the broken 2016 trend-line. Much work will be needed from here to ‘fix’ the charts for the long-side crowd.
FTSE 100: Daily
Join Paul on Tuesday for an in-depth discussion on global indices & commodities, for details see the Webinar Calendar.
---Written by Paul Robinson, Market Analyst
You can receive Paul’s analysis directly via email by signing up here.
You can follow Paul on Twitter at @PaulRobinonFX.


