


Talking Points:
- S&P 500 no net reaction to Fed, this week may be about more consolidation if not higher
- DAX is treading in a sound technical formation, looking for a resolution soon
- The BoE stirred the FTSE 100, but it’s still holding onto an important zone of support
Fundamental Forecast for Equity Indices: Neutral
S&P 500
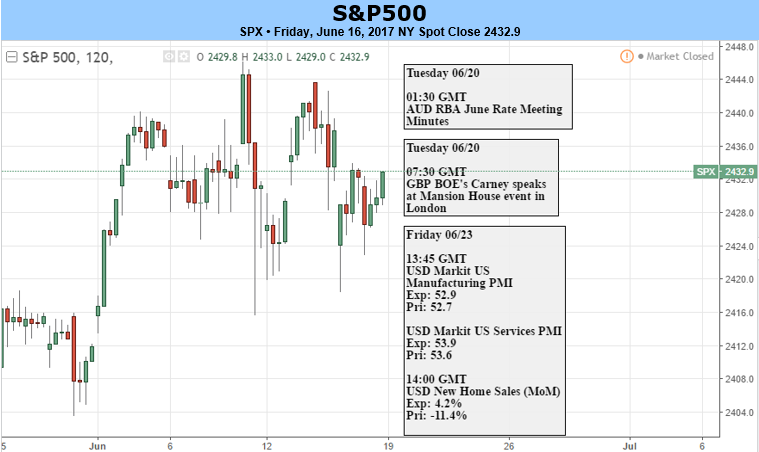
On Wednesday, the Fed raised rates by 25 bps as expected, and laid out a plan to unwind its balance sheet by $4.5 trillion, which it expects to begin this year. The overall tone of the Fed remains hawkish despite deteriorating economic data. The market gyrated following the FOMC announcement, initially lower but mounted a recovery to finish out the session close to where it began before headlines hit the tape.
Looking ahead to next week, the economic calendar holds no ‘high’ impact data releases, with a few ‘medium’ impact releases set for Wednesday-Friday. This will leave the market to operate on its own accord, a technically driven market if you will.
The net outcome of last week was relatively zero price movement, but there were some swings between key lines of support and resistance which kept market participants on their toes. The S&P is wedging itself up between the November slope (support) and top-side trend-line from February 2015 (resistance). Overall, we are seeing nothing more at this time than a period of consolidation within an uptrend, which should mean at some point we see a breakout towards new record levels. A break above 2446 will have our focus on the trend-line extending over peaks since March; it’s a moving target but currently clocks in near 2460. To undermine the recent digestion, and potentially kick-start a decline would be a break below the November slope and 6/9 low at 2415. The November trend-line would quickly come into play before having to worry about a more sinister decline setting in.
S&P 500: Daily

What’s driving stock markets? Check out our market forecast for details.
DAX
Looking ahead to next week, on the data-front the calendar is fairly light. There is one Euro-zone specific ‘medium’ impact data event on Monday and Thursday, and then a host of Markit PMI releases scheduled for Friday. For details, see the economic calendar.
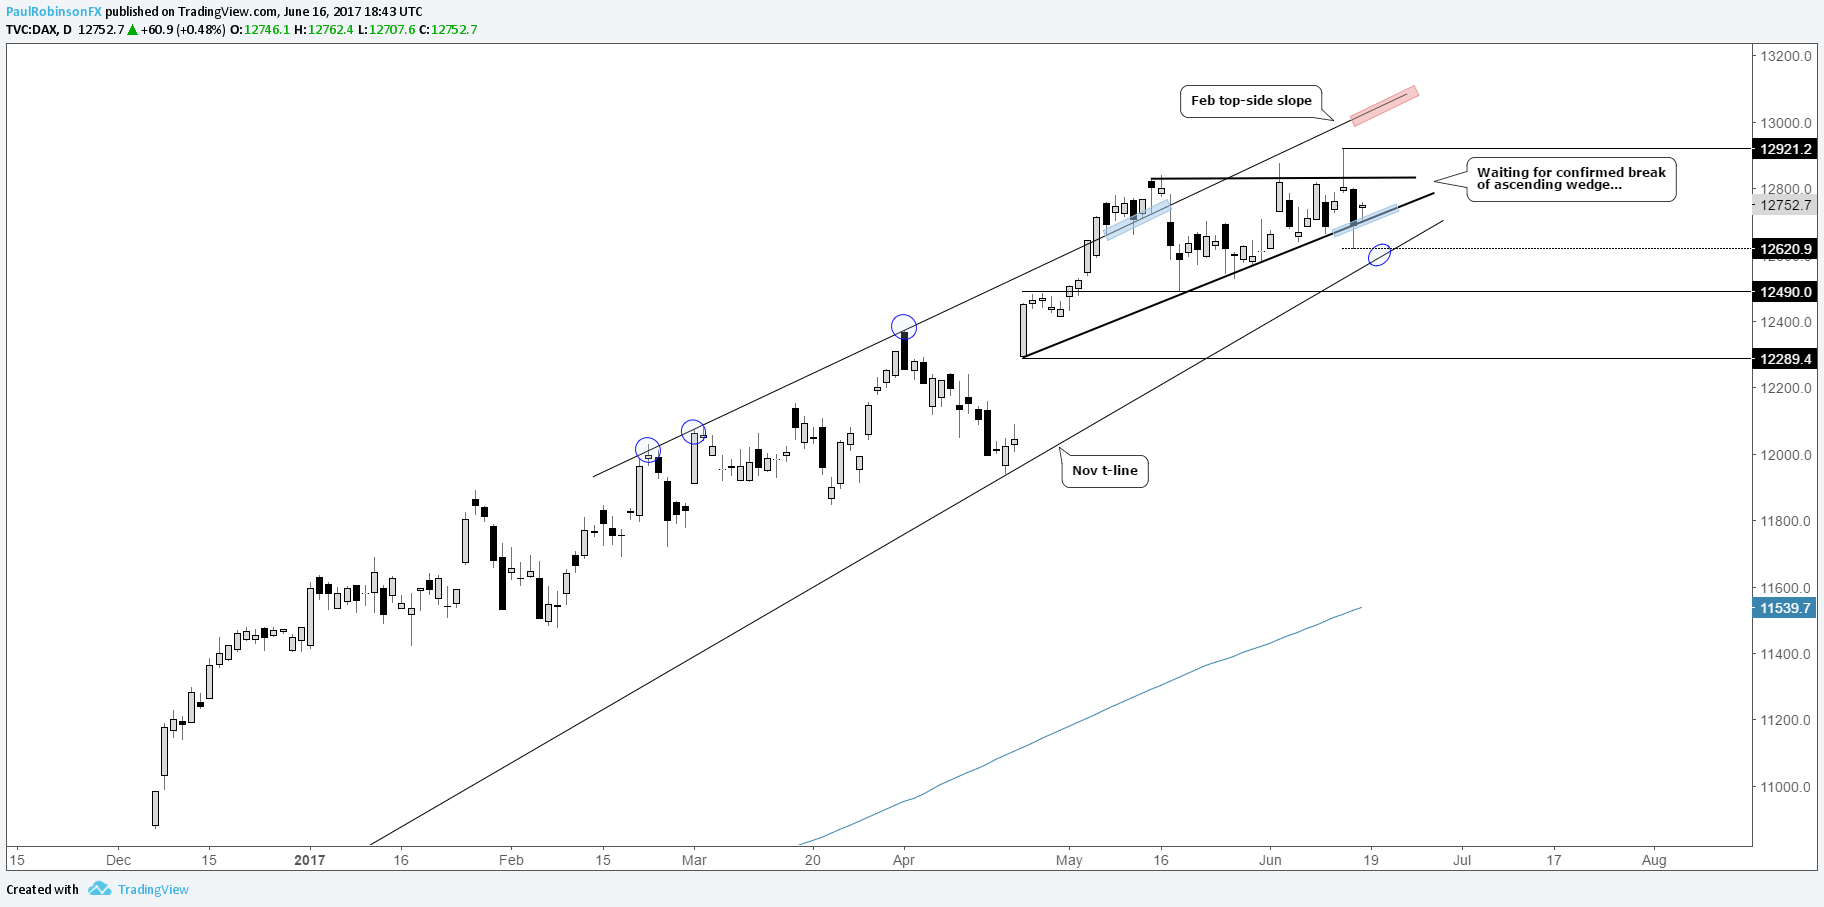
Last week was one of indecision for the German index, posting a weekly ‘doji’ candlestick. The attempt on Wednesday to break to new highs resulted in a daily key reversal bar – a new intra-day record was scored but not a closing one. The rejection-bar quickly brought in weakness the following day; it was enough selling to nearly break the lower trend-line of the ascending wedge it’s been building for a month now. But by day’s end it held just as the top-side line of the pattern did the day before. All-in-all, a failure to cleanly break the coiling pattern in either direction. Price is nearing the apex of the formation, and as such we should soon see a resolution. Taking into consideration trend and the ascending nature of the pattern, a bullish break is the more likely scenario. However, we must wait for a confirmation close outside of the pattern first to avoid a fake-out (as we saw last week). On a breakout and clearance above the Wednesday high, the next area of resistance comes in at the top-side February slope just over 13000 and rising. Should we see a breakdown, the November trend-line will quickly come into play as support. A break through there, though, and 12490 down to 12289 or worse could come into play.
DAX: Daily
FTSE 100
Last week, the Bank of England remained on hold with rates at 0.25% by a vote of 5-3, and decided to keep its current asset purchasing program steady by a vote of 8-0. Overall, there was a slightly hawkish tone to the outcome with two extra voters in favor of an increase. This sparked a rally in sterling (which eventually faded) and added to existing intra-day losses in the FTSE 100 (which were pared to a degree). Looking ahead to next week, data is light. For calendar details, see here.
The FTSE nearly broke major support by way of a top-side trend-line dating back to 2013 and several horizontal inflection points extending back to March. Once the dust settled, though, the index closed above this very important area of support. It will be critical for it to continue to hold if the footsie is to rally. A clean break below Thursday’s low at 7378 will quickly bring into play the June ‘16/’Brexit’ trend-line, and below there we would look to the February 2016 trend-line. Turning our attention higher, the January to March top-side trend-line has been problematic since mid-May, we look for this to continue to be the case in the near-term. A break above this key slope and 7600 will be needed to spark further buying interest into record territory,
FTSE 100: Daily

Live events held daily by DailyFX analysts, for a full line-up see the Webinar Calendar.
---Written by Paul Robinson, Market Analyst
You can receive Paul’s analysis directly via email by signing up here.
You can follow Paul on Twitter at @PaulRobinonFX.


