


Fundamental Forecast for USOIL : Bearish
- Crude Oil trades higher on the week, weekly candle is inside prior week’s price action
- Shale production growing at faster clip than expected, putting doubt on OPEC effectiveness
- OPEC meeting on May 25 is presumed by markets to extend cut, how long is the question
- Per Baker Hughes, US Oil Rig count rose 9 to 712 total showing increased pressure on OPEC
Will OPEC provide trade opportunities in Crude Oil with their market stability plan? See our forecast to find out what our top minds think on Crude !
The success of shale oil producers in the US has put the long-term positive effect of OPECs output cuts in doubt for some, but not all. Recently, we have seen weekly EIA reports showing large inventory draws, which could speak to rebalancing. However, US production continues to rise.
Some estimates show expectations that US production could be as high as 9.5m bbl/day, which is above production levels seen in late 2014 when the Crude Oil first traded below $70/bbl on an OPEC non-decision to cut production. The problem OPEC is having is that many of these US producers are turning a profit at the lower prices thanks to some hedging activity done when prices were near $50/bbl and given shale producer’s focus on the cheap-Permian shale region and their ability to lean up their production process.
This re-engineering of US oil companies have OPEC gaining support in prolonging output cuts for six months with some chatter on the length of the cuts extended and the amount of the cuts larger than the first round.
In the short term, Oil looks to be rebounding as Crude and Brent attempt to close higher on the week for the first time in a month. However, the global commodity landscape may be showing that demand is slipping on a broader scale even if production can balance out. The drop in Iron Ore and Copper help argue that demand from markets like China is trending lower, which may further dampen hopes of a return above $50 in the near future.
The chart below shows Crude Oil on a daily chart with a few technical indicators applied. The blob on the chart is Ichimoku Cloud, which is a trending indicator. Price is currently below the cloud, which favors a downside bias. Additionally, a prior rising support line (red) may now be acting as resistance or a price celling. If momentum turns lower via RSI(5) on the bottom of the chart, we could be in for a move to new 2017 lows soon.
Crude Oil current move seen as retracement, heavy resistance $47.50-50/bbl
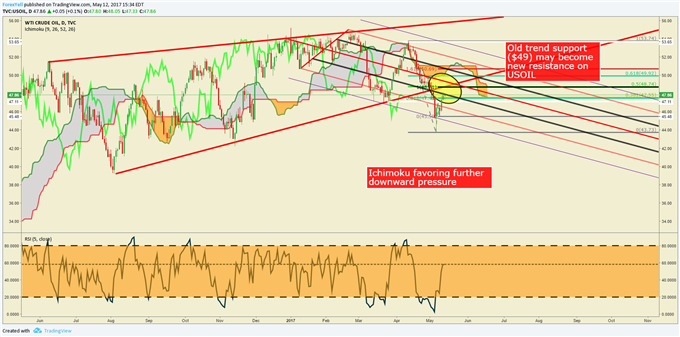
Chart Created by Tyler Yell, CMT
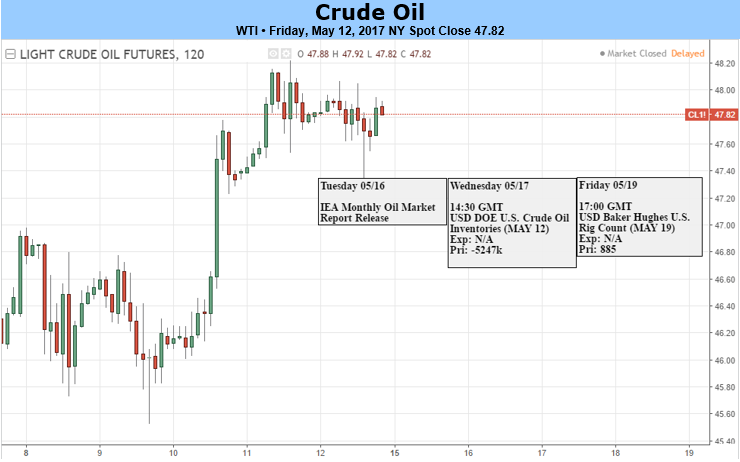
Next Week’s Data Points That May Affect Energy Markets:
The fundamental focal points for the energy market next week:
- Tuesday 4:30 PM ET: API weekly U.S. oil inventory report
- Wednesday 10:30 AM ET: EIA Petroleum Supply Report
- Fridays 1:00 PM ET: Baker-Hughes Rig Count at
- Friday 3:30 PM ET: Release of the CFTC weekly commitments of traders report on U.S. futures, options contracts
Crude Oil IG Client Sentiment Highlight: Contrarian view favors downside continuation
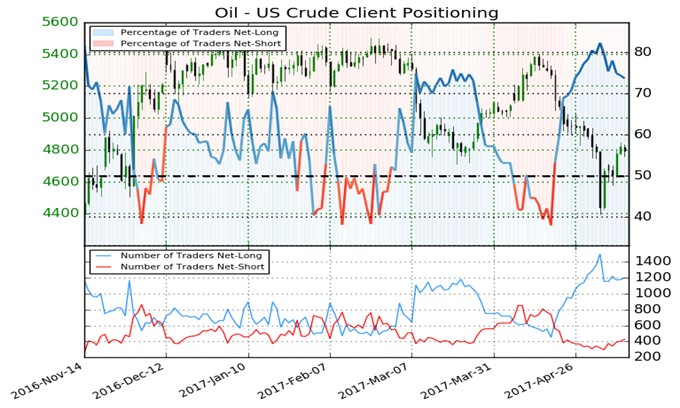
Oil - US Crude: As of May 12, IG retail trader data shows 73.7% of traders are net-long with the ratio of traders long to short at 2.81 to 1. In fact, traders have remained net-long since Apr 19 when Oil - US Crude traded near 5270.2; price has moved 9.0% lower since. The number of traders net-long is 2.1% lower than yesterday and 3.5% lower from last week, while the number of traders net-short is 5.3% lower than yesterday and 8.1% higher from last week.
We typically take a contrarian view to crowd sentiment, and the fact traders are net-long suggests Oil - US Crude prices may continue to fall. Positioning is more net-long than yesterday but less net-long from last week. The combination of current sentiment and recent changes gives us a further mixed Oil - US Crude trading bias. (Emphasis mine)
The insight derived is that traders are jumping on to the long side of a likely correction given the fundamentals that could continue to pressure Crude Oil Bulls. A breakdown below $45.50 would likely signal a n aggressive continuation of the downside that could see new 2017 lows.
-TY


