


Fundamental Forecast forUSOIL:Neutral
Talking Points:
- North American Oil Production at highest output levels since August 2015, per EIA
- Crude Oil Price Forecast: Downside Stalls on OPEC Favoring Extension
- Sentiment showing retail traders flipped to net-long favoring ST downside per contrarian effect
- Baker Hughes Rig Count Rises 5 Total to 688, 1 Added In Permian, 3 In Eagle Ford Shale
WillOil Resume Its Downtrend in 2Q? See our forecast to find out what is driving market trends!
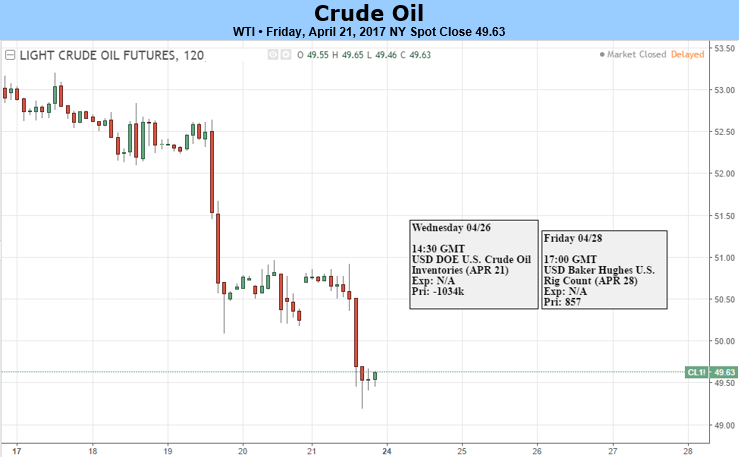
You wouldn’t know it by looking at the charts, but there was more encouraging news from OPEC as well as a US Inventory Draw on Wednesday per the EIA weekly release. Earlier this week, we heard that major oil producers had reached an initial deal to extend the output cut as cited per Saudi Arabia’s oil minister. The original goal of curbing production was to get stockpiles below the 5-year average, which has not been accomplished yet and seems to be a driving force for continuing the production cut another 6-months. While the producers admittedly look beyond the day-to-day price action, we could see price drops further encourage producers to approve the production cut extension. Additionally, many institutions remain upbeat on Oil as OPEC’s Technical Committee said on Friday in Vienna that the proposed 6-month extension was needed to help balance the market.
While there was an inventory draw in the US for crude Oil, we did have two discouraging findings that have carried further weight on the sell-off this week. First, Gasoline stockpiles rose for the first time in nine weeks, which was seen as a cue that demand may be waning though this aligns with typical seasonal effect. Secondly, US Production levels have reached their highest levels since August 2015. It is worth noting that the slope of active rigs in the US is expected to flatten, but there still appears to be concern that this trend could foil the efforts of OPEC to put the supply picture in a net deficit, which the IEA continues to predict for H2 2017. On Friday, wego word that the Baker Hughes Rig Count had risen by 5 active rigs to 688, 1 Added In Permian, 3 In Eagle Ford Shale. The USOil chart appears to have caught the attention of value buyers per the IG Client Sentiment discussed below. We see a move lower in the week that totaled roughly 5% making this week’s drop the largest since March. Recent sell-offs of this magnitude have not had stayingpower since we traded above the 55-WMA for the first time in multiple years in Q2 2016.
Given recent price action, after a sell-off where we have witnessed a strong bounce off the 55-WMA, we’ll look to the range of the opening range low for Q2 at $49.91 and the 55-MVA ($48.33) as a zone of support. If that level holds, the bias will remain bullish, which aligns with fundamental analysis shared above. However, a breakdown below this zone of support could set-up for a longer-term downtrend that tests the $41/bbl zone that acted as price support in H2 2016.
Weekly Chart Aligns With Emerging Sentiment Picture Showing ST Pressure Could Continue

Chart Created by Tyler Yell, CMT
Next Week’s Data Points That May Affect Energy Markets:
- Monday 2:30 am ET: China final March energy and commodity trade data, including crude.
- Tuesday 4:30 PM ET: API weekly U.S. oil inventory report
- Wednesday 10:30 AM ET: EIA Petroleum Supply Report
- Thursday (All Day): International Oil Summit in Paris
- Fridays 1:00 PM ET: Baker-Hughes Rig Count at
- Friday 3:30 PM ET: Release of the CFTC weekly commitments of traders report on U.S. futures, options contracts
After the first round of French Presidential Election, Monday will provide important demand data from China. At 2:30 pm PM Beijing time, we will get an understanding of March energy and commodity trade data. Thursday will also be the start of the International Oil Summit in Paris with the participationofoil officials from Libya, Iran, oil ministers from Iraq, Nigeria, Angola, Algeria, the OPEC Secretary-General Barkindo, as well as the CEOs of Total and Saudi Aramco.
Oil Sentiment Picture From IG Traders

Oil - US Crude: As of April 21, retail trader data shows 60.1% of traders are net-long with the ratio of traders long to short at 1.51 to 1. The number of traders net-long is 8.3% higher than yesterday and 53.3% higher from last week, while the number of traders net-short is 7.9% lower than yesterday and 33.9% lower from last week.
We typically take a contrarian view to crowd sentiment, and the fact traders are net-long suggests Oil - US Crude prices may continue to fall. Traders are further net-long than yesterday and last week, and the combination of current sentiment and recent changes gives us a stronger Oil - US Crude-bearish contrarian trading bias.


