


What’s inside:
- S&P 500 still wavering in its search for direction; correction over or to continue?
- FTSE 100 takes a hard hit on election announcement, starting week at key support
- The big headline for the CAC 40 is the French presidential election on Sunday
S&P 500
Markets will start out the week with the French presidential election on their minds, but to what impact it will have on U.S. markets likely depends on the magnitude to which Europe moves, and any reaction the U.S. has may be short-lived. Looking to key economic events on the docket; ‘high’ impact data releases include Consumer Confidence on Tuesday, Advanced Goods Trade Balance and Durable Goods Orders on Thursday, and 1Q GDP on Friday. President Donald Trump announced on Friday that he will unveil a tax plan this coming week. Markets will almost certainly show a response once the details are released.
Last week, the S&P closed higher after two consecutive down weeks, but is struggling to overcome a top-side trend-line running down off the March 1 record high. A solid close above this line of resistance, along with a recapturing of the November trend-line and break above the 4/5 swing high at 2378 will be considered a big positive; significantly increasing the likelihood the multi-week correction is over. However, if the market can’t push above noted levels we look for it to move lower towards the 4/13 low at 2329 and March low of 2322, and possibly carve out a lower low towards 2300. The final line of support should selling become aggressive will be the trend-line rising up from the February 2016 low. Overall, price action in recent weeks – whether a rally commences from here or from lower – is viewed as a correction of the ‘Trump Trade’, and will likely lead to new record highs down the road.
S&P 500: Daily

Created with TradingView
For a longer-term view on markets, check out our Q2 forecasts.
FTSE 100
To start the week, markets will take interest in how events pan out with the French presidential election. U.K. election headlines will remain a constant risk moving forward. Looking to the economic calendar the only ‘high’ impact data set to be released is 1Q GDP on Friday. For the full schedule of data to be published, see the economic calendar.
On Tuesday, the FTSE 100 took a spill of nearly 2.5% on the announcement by Theresa May for an early general election. The drop came after a final struggle at the 2013 top-side trend-line we’ve been discussing here for a few weeks. The June trend-line and triple bottoms since mid-March were easily cleared along with a swing-low in February. Last week, the footsie closed right on important support surrounding 7100, which consists of the prior peak in October turned support in early February. If the market can’t begin to mount a recovery from here it’s at risk of further losses in the week ahead, with the 200-day MA as the next level of support. If support holds we will look to 7192 as the first level of resistance, and with a strong rebound the multi-week bottoms in the 7155/63 vicinity could come into play.
FTSE 100: Daily

Created with TradingView
CAC 40
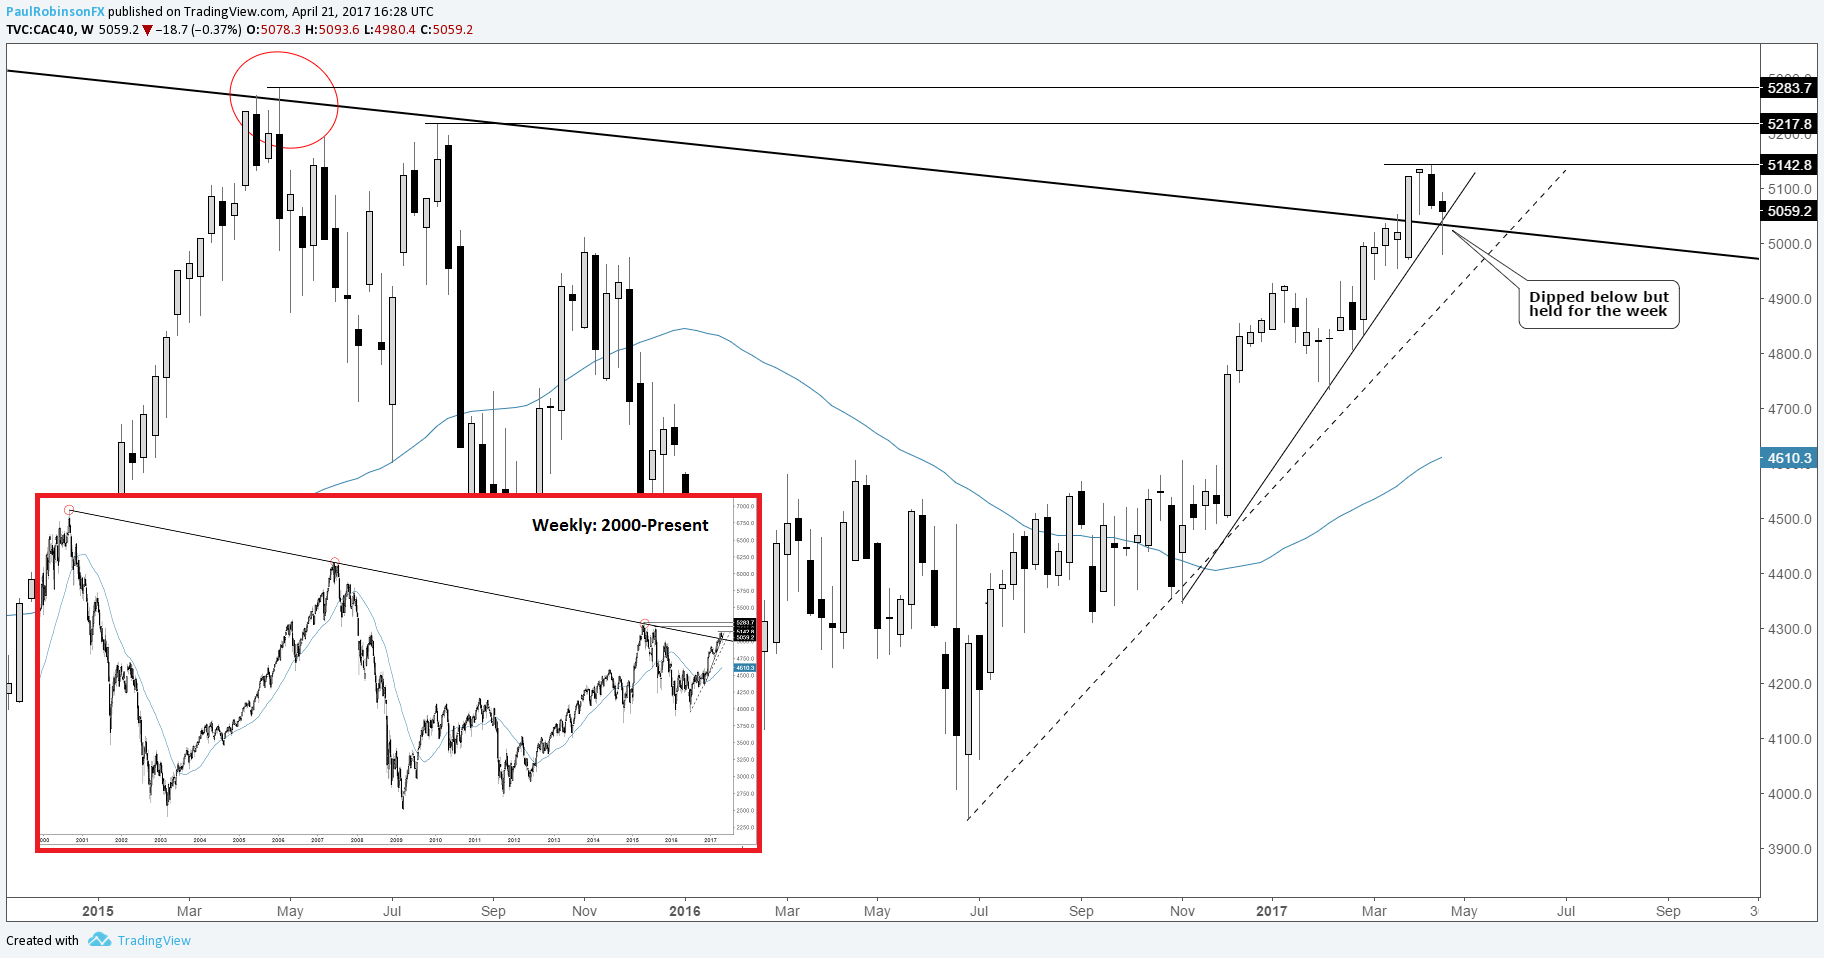
The market’s attention will be fully placed on the French presidential election on Sunday. It’s currently a tight race and difficult to make a call on who will win, but there is a high likelihood that none of the candidates secure the necessary number of votes for an outright win. This will lead to a run-off vote between two candidates on May 7. (See here for further details.) How the market will react is nothing more than a guess, so on that we will take a reactionary stance during these uncertain times.
Looking at the weekly chart, the CAC broke out and closed on a weekly and monthly basis above the trend-line extending down over the 2007 and 2015 peaks from the 2000 record high. This past week the market took a hit back below the trend-line, but managed to close the week back above it. So far, a successful retest. Election aside, this leads us to believe we could see higher prices as long as last week’s low of 4980 holds.
CAC 40: Weekly
Created with TradingView
For a line-up of live events held each week, see the Webinar Calendar.
---Written by Paul Robinson, Market Analyst
You can receive Paul’s analysis directly via email by signing up here.
You can follow Paul on Twitter at @PaulRobinonFX.


