


What’s inside:
- S&P 500 declined sharply on Tuesday, weak price action after leaves it vulnerable
- DAX broken rising wedge is coming into question, next few days will be important
- CAC 40 trading up against 16 ½ year trend-line, similar chart structure as DAX
Paul conducts webinars geared towards indices and commodities every Tuesday, for details see the Webinar Calendar.
S&P 500
The economic calendar for the coming week is light with ‘high’ impact events. We have Advance Goods Trade Balance and Consumer Confidence on Tuesday; Final Q4 GDP on Wednesday; Core Personal Consumption Expenditure (PCE) on Friday. It’s unlikely any of these events cause a major stir in equities; the larger reactions will likely to be seen in the FX/rates space.
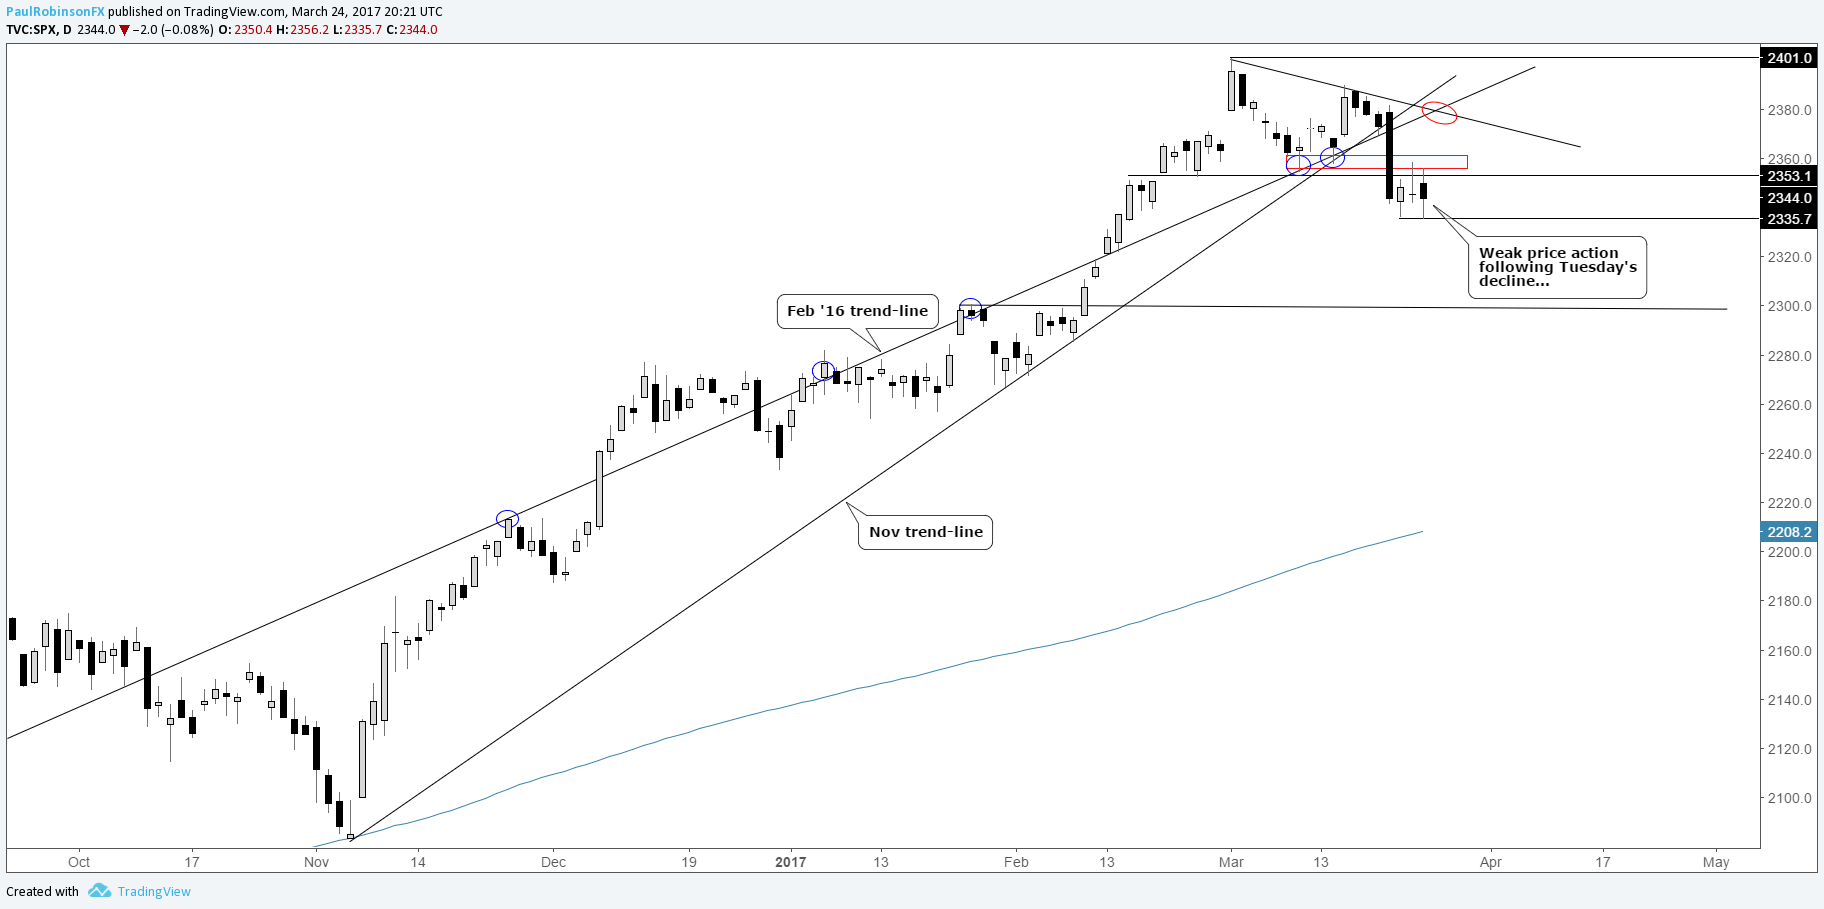
Tuesday brought the first 1%+ decline in the S&P since the presidential election, which now has the market on its heels after breaking the confluence of trend-lines we were focusing on heading into last week. The three days to conclude the week demonstrated weak price action, as the market hemmed and hawed its way back higher before selling off Friday afternoon, then gyrating in both directions into the close as the GOP ‘American Health Care Act’ was pulled from an expected vote.
Overall, the sideways price action following the Tuesday swoon isn’t very encouraging and sets the market up for a continuation-trade lower in the week ahead.
On the top-side, the S&P needs to climb above the 2354/60 zone if it is to gain traction towards the trend-line running off the early-month record high; confluence of this t-line with the underside of the Feb 2016 trend-line may make the area close to 2380 an important one if reached.
S&P 500: Daily
Created with TradingView
DAX
Next week’s scheduled ‘high’ impact data releases include German CPI on Thursday; German unemployment data and Eurozone CPI on Friday.
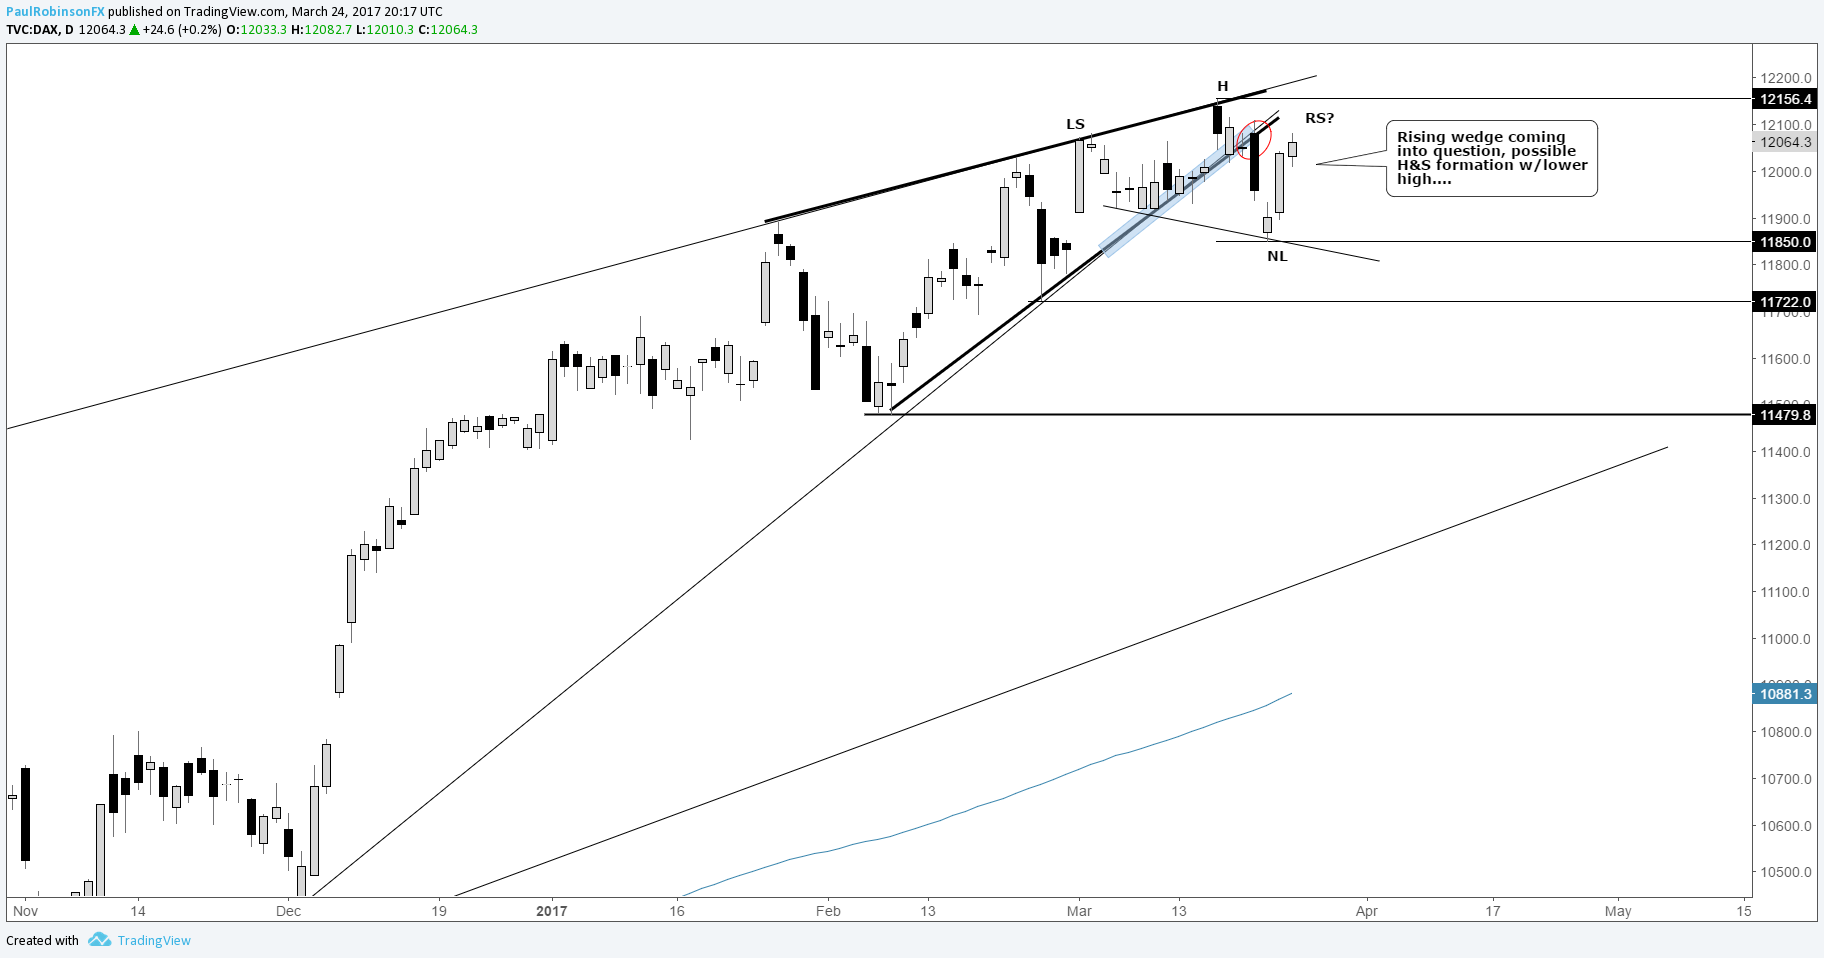
Last week, we placed a lot of emphasis on the DAX for directional cues in general risk trends given it had at that time the clearest technical formation of the major indices. The rising wedge formation broke to the downside, but the DAX quickly found a low early Wednesday and recovered to close out the week. The rally doesn’t fully undermine the bearish break, but if it doesn’t turn lower soon we will need to consider alternatives. The Wednesday low carved out a lower low from 3/8, and with a downturn soon we could have a lower high in place from the 3/16 peak. In this scenario, the price sequence for the month of March will begin taking on the shape of a ‘head-and-shoulders’ pattern. We would of course need to see a break of the neckline and drop below 11850 before getting the green light. On weakness below last week’s low we will look to 11722, then nothing substantial arrives until the February low of 11480.
On continued strength the prior high of 12156 will quickly come into focus as our first focal point of resistance, and should the market rise above, it would negate the bearish implications of the rising wedge.
DAX: Daily
Created with TradingView
CAC 40
Looking ahead on the calendar, the notable events worth keeping an eye on are the same as for the DAX – a couple of German numbers and Eurozone CPI.
The CAC has a similar rising wedge as the DAX, but with the apex arriving at a very interesting spot – the trend-line running down from the 2000 record high (crosses over peaks in 2007 & 2015). If both the DAX and CAC negate the bearish rising wedge, then the CAC will be trading above long-term trend resistance. Given the trend-lines duration it would be best to wait for a strong weekly close above before calling it a valid breakout. But if it does, then we could see much higher prices. For now, though, we will treat it as a major barrier.
Should we see weakness, the first line of support comes in by way of the trend-line off the November low. There were a couple of solid inflection points created in February along this line, so it will be an important one to watch. There could be confluence, depending on the timing, with the Wednesday swing low of 4953; 4934 is another pivot to keep on the radar.
CAC 40: Daily

Created with TradingView
Looking for trading ideas? See our Trading Guides.
---Written by Paul Robinson, Market Analyst
You can receive Paul’s analysis directly via email by signing up here.
You can follow Paul on Twitter at @PaulRobinonFX.


