


Fundamental Forecast for USOIL: Bullish
- Front-Month WTI Continuing To Struggle Near 19-Month Closing High, APF Resistance
- Technical Post: Crude Oil Price Forecast: WTI Within 1XATR Of 2017 Highs On OPEC News
- U.S. Crude Inventories At Highest Level Since October 1930
- See the DailyFX Economic Calendar to find what live coverage for key event risk influencing FX and Energy markets is scheduled for the coming days on the DailyFX Webinar Calendar.
Where will the Crude Oil go in the first quarter of 2017? Get our forecast here !
The Oil market finds itself in a unique spot of the commodity landscape of Q117. Two of the largest global suppliers, the United States Shale Oil Producers and the Organization of Petroleum Exporting Countries (OPEC) are trending in different directions while the price seems to have stalled near the 2017 Opening Range high.
Regarding US Production, on Friday, the Baker Hughes US Oil rig count topped 600 for the first time since 2015. The rise in U.S. production can be seen through the weekly Department of Energy Data that has seen a sharp rise and can be seen on the chart below that has the front-month Crude Oil contract price overlaid.
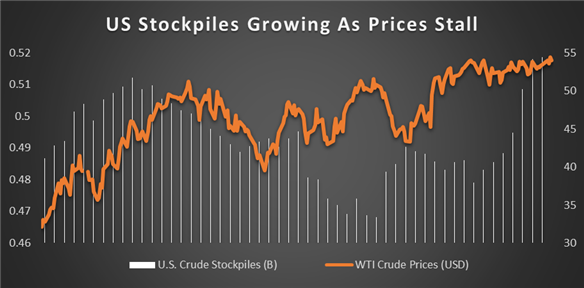
Data Source Bloomberg
In contrast to the sharp rise in the production of Shale Oil in the US, we have seen OPEC compliance with their accord to balance the supply and demand imbalance. The chart below captures the drop in OPEC production that is expected to last through August.
This tug-of-war of trying to balance the market has the price stuck in the middle. We continue to see US Rigs per the Baker Hughes Rig Count come onto the market so the compression of price volatility could continue. Fortunately for the Bulls with a longer-term horizon, the lower volatility has aligned with an uptrend.
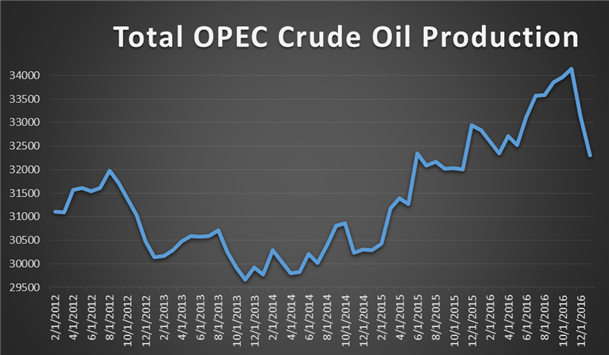
Data Source: Bloomberg
Technical View:
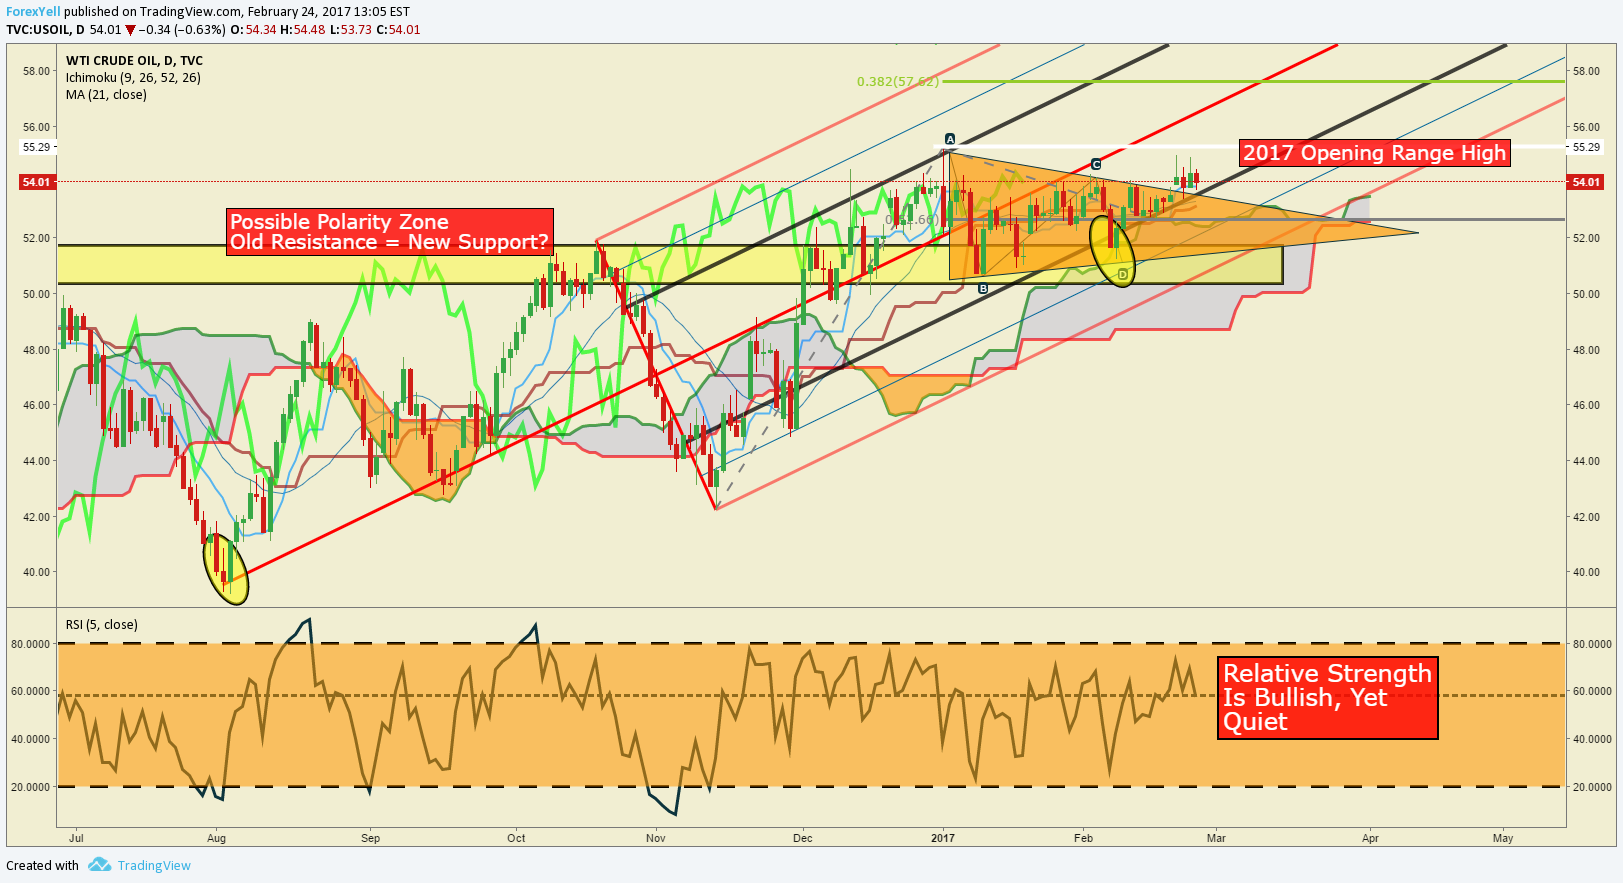
The chart below should be encouraging to the Bulls despite US production increase, especially the patient ones as we look to have found a new and higher price floor that is highlighted on the chart above. In addition to the perceived higher price support, the price of WTI traded above the 2017 Opening Range high of $55.21 on a closing basis. Crude Oil’s attempt to breakout from its 2-month price range should hold traders attention.
The chart shows the lack of volatility in a Bullish environment, which for most Bulls, is just how they want the market behaving. Low volatility in an uptrend is what we’ve seen for most of the S&P’s historic rise. Therefore, low volatility in and of itself should not be a reason for Bears to jump in and take Oil to or below anticipated price support.
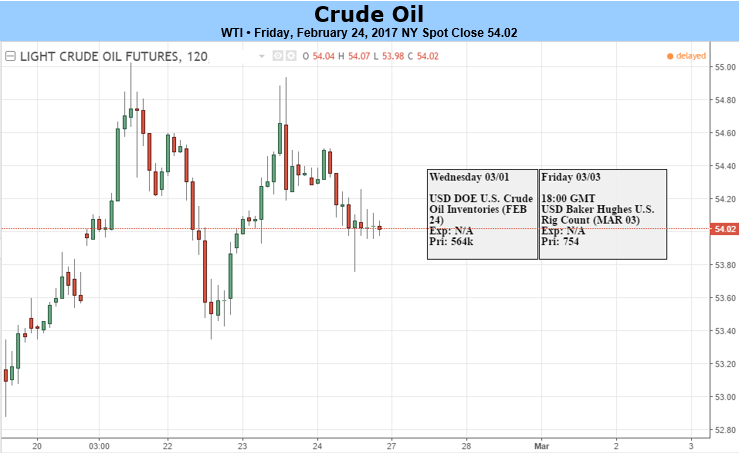
Next Week’s Data Points That May Affect Energy:
The focal points for the energy market next week will remain Wednesday’s EIA Petroleum Supply Report at 10:30 AM ET and Friday’s Baker-Hughes Rig Count at 1:00 PM ET.
Happy Trading!
-T.Y.


