


What’s inside:
- U.S. stocks appear to be in a ‘blow-off’ stage, complacency running high
- DAX is set up to test top-side levels
- Nikkei 225 consolidating or demonstrating relative weakness?
Looking for trading ideas? See our Trading Guides.
Last week was a generally bullish one for equity indices outside of Japan, with U.S. and European markets showing modest to strong gains. Volatility was muted, something which traders are hoping will soon change. Looking ahead to next week, though, there isn’t any major scheduled data points or events on the docket outside of a couple key economic releases, of which neither are anticipated to upset markets too much.
On Wednesday, we have UK GDP and the FOMC minutes, with other minor data points peppered throughout the week. See the economic calendar for details. While these ‘high’ impact releases could induce volatility, it is likely to be more impactful for the FX and rates markets than equities. With that said, we look for the recent bullishness to persist, but not without growing risk as investor optimism tilts further towards complacency.
The U.S. has been on fire, and while a bullish bias is likely to persist and perhaps even speed up if we are amidst a ‘blow-off’ stage, risk is rising significantly for long positions, especially new ones. The average level of the CBOE Volatility Index (VIX) – also known as a ‘fear barometer’ – over the past month is at 11.3, the lowest the one-month average has been since the summer of 2014. It wasn’t long after reaching such persistently low readings in the VIX that the market experienced about a 4% haircut. Risk of a flare-up is rapidly rising as investor complacency grows. With that in mind, we are taking caution from the long-side, but have yet been provided a good reason to turn bearish. Heading into next week, on further strength we will look to the backside of the steeply rising November trend-line as potential resistance; given its angle, depending on the timing, the level comes in at ~2369-2385. On a minor dip, we will look to the Feb ’16 trend-line the market arched over last week as potential support: ~2332-2339.
S&P 500: Daily

Created with TradingView
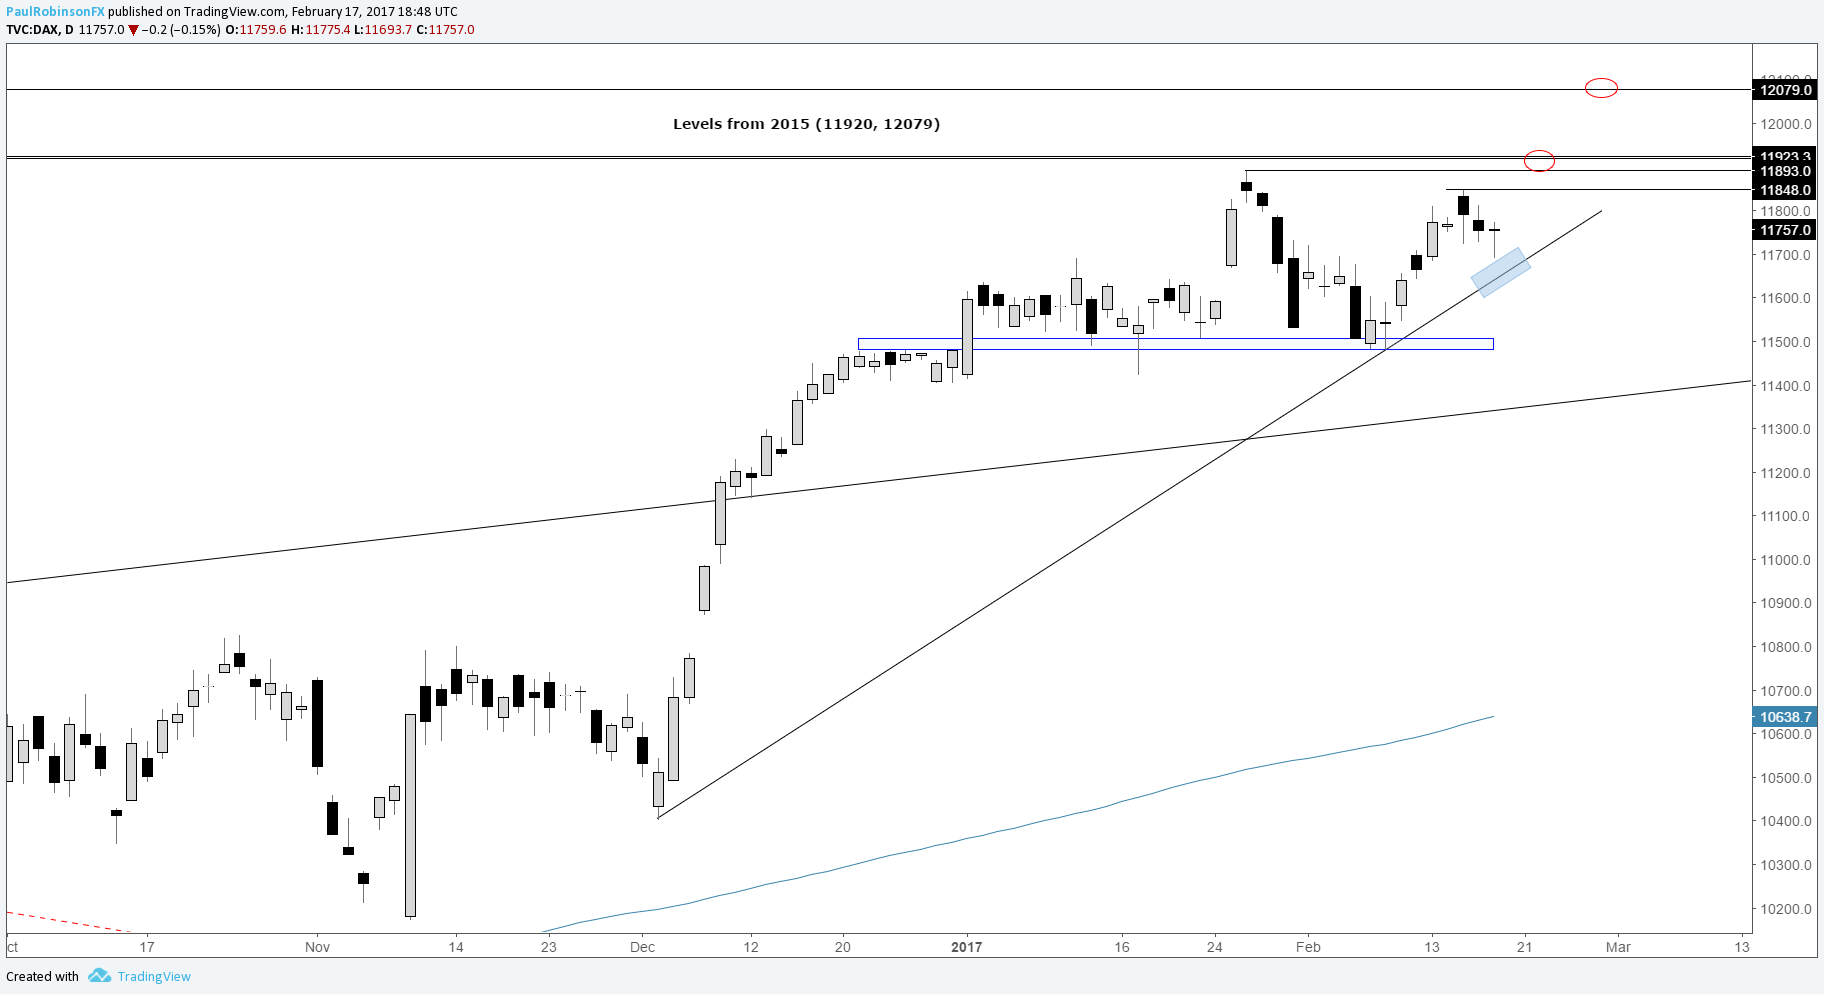
DAX
The DAX posted all of its weekly gains on Monday, and tried to give those back by week’s end before a solid rebound took shape Friday afternoon. Overall, the picture is constructive and we view the DAX as having potential this coming week to take out 11848 and challenge the Jan high of 11893. On a break above, the market will begin facing off against swing highs created during the decline off record highs in 2015. The most notable levels are 11920 and with a strong bid up to 12079. Should we see weakness there is support by way of a trend-line back to the beginning of December.
DAX: Daily
Created with TradingView
Nikkei 225
After a modestly volatile week, the Nikkei finished lower. Overall, the period from December until now remains constructive; viewed as a consolidation, maybe even a developing triangle, from which the Japanese index could launch into the 20k mark in the not-too-distant future. The general bias, though, is neutral for now. It’s also possible the lag in Japan relative to other global indices is a sign of weakness to come. For now, we will wait for further confirmation one way or another before drawing any concrete conclusions. We will look to the a top-side trend-line at around 19475 as resistance, with a break above the 2/13 high of 19519 as giving the Nikkei potential to begin an advance towards hitting 20k. It will of course need to break above 19615 for full clearance. On the downside, watch the 2/10 gap-day for a possible fill. On Friday, the market dipped slightly below the gap-day low, but closed back above. A fill of that gap would carry the Nikkei down into the lower trend-line in the 18970 vicinity, with swing lows beneath at 18805 and then 18650. A break below those levels likely means we are seeing some form of risk-off on a global basis. No notable news events on the docket to get excited about.
Nikkei 225: Daily

Created with TradingView
See the Webinar Calendar for a schedule of upcoming live events with DailyFX analysts.
---Written by Paul Robinson, Market Analyst
You can receive Paul’s analysis directly via email by signing up here.
You can follow Paul on Twitter at @PaulRobinonFX.


