


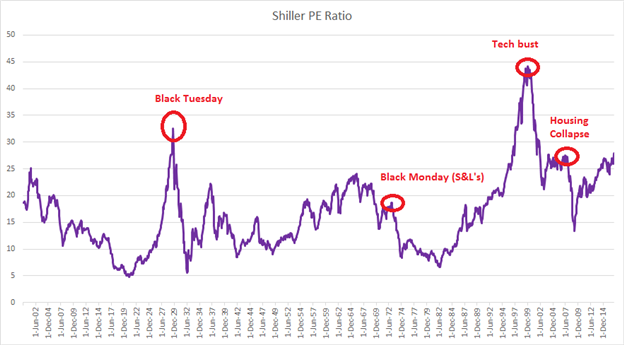
As we move into 2017, equities have been driven-higher with the euphoric hope of the congruent alignment of both fiscal and monetary policies from the United States. This has driven U.S. stocks into frothy-territory, with the S&P 500 hitting historically-expensive levels on the Shiller PE-ratio, now reading over 27.5 and making a fast approach at the 30-level. There have only been two prior instances of Shiller PE reading over 30 since 1900; the first was in 1929 just ahead of the Great Depression and the next was the ‘tech boom’ which turned into the ‘tech bust’ shortly thereafter.
So, sure; maybe this time is different. Maybe the potent cocktail of a gun-shy Central Bank, and the hopes of a robust fiscal stimulus plan are enough to create a ‘new normal’ for stock values. Something the likes of which the world has never seen, at least not since 1900, as investors eschew fundamentals and just continue to chase higher-prices on the basis of hope and change.
More likely, however, is the fact that we will see the Federal Reserve continuing to attempt to ‘normalize’ policy, at least until something breaks; at which point they’ll likely come back-to-the-table with some other form of dovish monetary policy. When the Fed pivots here, this is when you will likely want to look at the long side of stock indices, as whatever ‘pivot’ the Fed poses will probably be in consideration of the ‘Trump Trade’ with the hopes of fiscal stimulus coming down-the-pike.
While the hope of fiscal stimulus taking over and obviating the need for additional monetary measures is very realistic, and perhaps even pragmatic, the fact of the matter is that fiscal stimulus takes time. That’s the beauty of monetary stimulus; that it’s relatively quick and can be implemented in the near-term. Fiscal stimulus takes years, as bills need to be drawn-up, debated and ‘massaged’ until they can get enough support to get approved in Congress. And even then – implementing those measures takes even more time; so foreseeably it can be 2-4 years, at the earliest, before benefits of fiscal stimulus measure might really show-up in the American economy.
And again – this isn’t necessarily a ‘bad’ thing; it’s just that stock prices may have gotten a bit ahead of themselves with the near-parabolic like move that showed up after the U.S. Presidential election.
S&P 500 – Fundamental Forecast: Neutral
The S&P 500 is up approximately 12% from the election-night lows. While the momentum on the recent up-trend is really attractive, it’s difficult to justify pure-long stances at current valuations. The S&P 500 could become attractive should prices fall to catch support in the zone from 2,100-2,155. Traders would want to confirm that Daily support in fact holds in this zone before looking long; but should this take place, this would be the ‘buy the dip’ strategy at work. If prices then move to break below 2,032, traders would likely want to abandon the bullish stance, beginning to look bearish on breaks below 2,000.
DAX – Fundamental Forecast: Bullish
While U.S. stocks sit in ‘expensive’ territory, European stocks have just begun to come back to life after spending much of this year congesting. Price action in December finally brought the DAX back up to levels from last December around 11,452. With the combination of a robust ECB QE program driving liquidity for the first three months of next year, we could certainly see some continued-gains in the DAX to test those prior all-time-highs in the 12,400-vicinity.
CAC40 – Fundamental Forecast: Bearish
French elections in April introduce a heavy-dose of political risk to this market, and we’ll likely see some element of anticipation in Q1 as we approach those elections. And while the world is coming off of two rather contentious geo-political issues in Brexit and Trump, with both being resolved by even-more gains in equities; this French election cycle comes with a dash of extra risk. Should National Front or Marie Le Pen take more prominence in the run-up to the election, we’ll likely see French stocks facing some additional element of pressure.
Nikkei – Fundamental Forecast: Bullish
The Bank of Japan has been buying stocks for over two years now. And in September, the BoJ got unlimited-firepower for future QE-efforts by swapping to a yield-curve target rather than a rigid and set amount of bond purchases every month; and there is no end-date in sight.
As long as the global ‘recovery’ continues, the Yen should remain weak as driven by the Bank of Japan’s uber-dovish policies. And with weak-Yen, Japanese stocks will likely continue to accrue in value on the basis of more earnings for exporters (weaker Yen means exporters bring back more from overseas transactions).
Technical Outlook:
S&P 500
The final quarter of 2016 ended with a bang following the U.S. presidential election; the ‘Trump Trade’ went full-steam ahead. The rally made for the fifth consecutive quarter of gains. Heading into the first quarter of 2017 the market is set up to continue moving higher, but any gains experienced early-on will be at risk of getting erased as market conditions and sentiment move further into overbought territory.
It’s not prudent to fight a strong trend at or near record highs, but caution here from the long-side is warranted. We will look to dips as potential opportunities to continue trading from the long-side with one eye on the exit. With that in mind, should we see a strong reversal in price action we will be quick to cash in our cautiously bullish stance in favor of a neutral to bearish one.
On the top-side, there is the upper parallel married to the trend-line rising up off the Feb 11 double-bottom lows. It’s a moving target depending on the timing of when the market reaches it, if in fact it does, roughly in the range of 2320/75. A rise to the top-side parallel would be watched with great interest as the market will have become quite extended at that point. On the bottom-side, support begins at a trend-line crossing over peaks created in early 2015 and the August highs, currently running around the 2210 mark. Not far below that point lies the August high at 2194. This area combined down to the February trend-line (~2160/80) will be viewed as an important region of support. It would take a break of the Feb trend-line for a potentially broader trend change to be considered. At that juncture, not only will the trend have become undermined, but all key support levels will have been firmly breached as well.
S&P 500: Weekly

DAX
The DAX underwent a significant breakout in early December once it was able to trade above a four-month long barrier surrounding 10800. The trend remains higher since the February low, and momentum into the end the year was only outshined by the Nikkei. We will respect momentum until it shows signs of slowing, but like other global equity markets it is becoming increasingly vulnerable to a set-back as market conditions become increasingly overbought.
On the top-side, if the DAX can stay above the November 2015 peak at 11431, there still room to run before several swing highs from 2015 come into play as resistance; 11670, 11796, 11920, 12079, and with serious buying pressure the DAX could carry higher into the 2015 record high of 12391. Along the way into those upper levels lies a top-side parallel attached to the Feb ’16 trend-line, which could make for an interesting point of confluence. On the bottom-side, there isn’t much in close proximity at this time given how sharply the market has rallied since the December breakout. The first major support at this time doesn’t arrive until the breakout zone at 10750/828. However, should the DAX continue through previously mentioned resistance levels we will take note as to how the market reacts to these resistance levels turned support.
DAX: Weekly

During Q4, the FTSE 100 benefited from a weaker British pound following ‘Brexit’ along with healthy global risk appetite. The majority of profits earned by companies in the 100 index are earned outside of the UK, therefore increasing those profits when they are converted from the foreign currency they are earned in back into the local currency. However, despite having tailwinds from the pound and strong risk trends, the FTSE was one of the weakest of the major global indices during the late Q4 run (‘Brexit’ headwinds).
The FTSE faces a challenge in crossing and staying above record high levels (closing price = 7104, intra-day = 7130). If global markets continue to march higher the FTSE will likely benefit and keep rising within the channel dating back to the Feb lows, but while doing so it is poised to hold onto its laggard status. If world markets start to falter in overbought territory, the UK index is set up to lead to the downside as its laggard status sparks increased selling interest. It’s weak on a relative basis for a reason.
The first top-side level to look to is the 7104/130 area (record highs depending on how you tabulate; closing high/intra-day high). Beyond there nothing substantial to note until the upper parallel tied to the Feb trend-line, ~7400. On the bottom-side, we will look to the lower parallel in the area of 6850 and then the October low at 6676. A break below the October low would be considered a significantly negative development lending to a possible larger trend change.
FTSE 100: Weekly

Nikkei 225
The Nikkei was one of the most impressive markets to end 2016, demonstrating vertical price behavior with its rise from around 16k to well over 19k. Looking to our left there is still room to run to the 20k mark; it’s not just a psychological level, but a real one as the Nikkei traded above it by 12 handles before carving out a major turning point in November 2015. Should we see a rise to that level without any retracement between now and then, the market will be in position to experience a setback as overbought market conditions meets resistance. However, the Nikkei is known to be a high momentum index, and with that a push through the 20k level could develop and bring into play the 2015 peak (highest level since 2000) just shy of 21000. We will respect the strong upward trend for now and take careful note isn how the market reacts should important resistance levels come into focus.
On the top-side, 20012 and then 20947 are the primary levels of interest. On the down-side, similarly to the DAX, there isn’t significant support close at hand. A trend-line rising up from the June low may act as support, but that won’t come into play until the low 18000s. Below there the next really solid area of support isn’t until 17400/600, where the market broke strongly above following the U.S. election.
Nikkei 225: Weekly

Written by James Stanley, Currency Strategist and Paul Robinson, Market Analyst for DailyFX.com
Disclaimer
DailyFX Market Opinions
Any opinions, news, research, analyses, prices, or other information contained in this report is provided as general market commentary, and does not constitute investment advice. DailyFX will not accept liability for any loss or damage, including without limitation to, any loss of profit, which may arise directly or indirectly from use of or reliance on such information.
Accuracy of Information
The content in this report is subject to change at any time without notice, and is provided for the sole purpose of assisting traders to make independent investment decisions. DailyFX has taken reasonable measures to ensure the accuracy of the information in the report, however, does not guarantee its accuracy, and will not accept liability for any loss or damage which may arise directly or indirectly from the content or your inability to access the website, for any delay in or failure of the transmission or the receipt of any instruction or notifications sent through this website.
Distribution
This report is not intended for distribution, or use by, any person in any country where such distribution or use would be contrary to local law or regulation. None of the services or investments referred to in this report are available to persons residing in any country where the provision of such services or investments would be contrary to local law or regulation. It is the responsibility of visitors to this website to ascertain the terms of and comply with any local law or regulation to which they are subject.
High Risk Investment
Trading foreign exchange on margin carries a high level of risk, and may not be suitable for all investors. The high degree of leverage can work against you as well as for you. Before deciding to trade foreign exchange you should carefully consider your investment objectives, level of experience, and risk appetite. The possibility exists that you could sustain losses in excess of your initial investment. You should be aware of all the risks associated with foreign exchange trading, and seek advice from an independent financial advisor if you have any doubts.


