


US STOCKS OUTLOOK:
- S&P 500 plunges amid mounting recession fears
- Commodities, such as oil and base metals, also decline as growth concerns weigh on their outlook
- This article looks at key technical levels to watch for in the S&P 500 in the coming sessions
Trade Smarter - Sign up for the DailyFX Newsletter
Receive timely and compelling market commentary from the DailyFX team
Most Read: US Dollar Price Action Setups - EUR/USD, GBP/USD, USD/CAD and USD/JPY
Following the July 4th Independence Day holiday, Wall Street reopened on Tuesday. Investors hoping for sentiment to recover and risk appetite to stabilize after a disastrous second quarter were in for a rude awakening.Not only did the mood not improve, but the broader tone seems to be deteriorating on growing worries of a downturn. Against this backdrop, the S&P 500 trader sharply lower at midday, down about 1.9% to 3,752, moving further into bear market territory, tracking European stocks’ weakness, and erasing more than half of the late June rally. The selling was widespread, and commodities such as oil and base metals also plunged, a sign that price swings are being driven by growth concerns.
Looking ahead, there are several high impact events on the U.S. calendar that could spark volatility, including the ISM Services, the FOMC minutes and the June Non-farm payrolls report. High-frequency data and several surveys suggest that economic activity is weakening at a rapid pace, so traders should prepare for the possibility of disappointing data in the coming days and weeks, a scenario that will likely reinforce the hard-landing hypothesis and undermine performance in the equity space.

Although the recession narrative is gaining traction, most financial firms haven’t yet downgraded corporate earnings to reflect current downside risks, with their research desks still forecasting an S&P 500 margin expansion for next year despite mounting headwinds, such as sky-high inflation and cooling demand. In any case, once the second-quarter reporting period gets officially underway next week, results and guidance are likely to disappoint Wall Street’s projections, paving the way for analysts to start lowering EPS expectations, especially for some cyclically oriented sectors. These negative revisions could trigger the next meaningful leg lower in stocks.
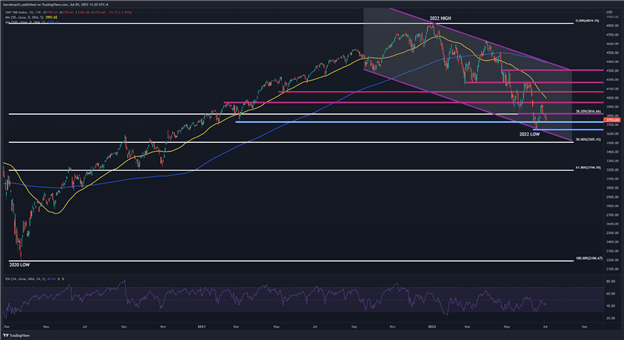
In terms of technical analysis, the S&P 500 is approaching a key technical support near 3,730 after Tuesday’s nosedive. If sellers manage to breach this floor in the coming sessions, the index could be on its way to retesting its 2022 lows near 3,640. On further weakness, the focus shifts down to channel support around the psychological 3,600 level. On the flip side, if dip buyers wrestled control of the market away from bears, initial resistance appears at 3,820, followed by 3,950, but the bullish scenario looks increasingly unlikely.
| Change in | Longs | Shorts | OI |
| Daily | 7% | -7% | -1% |
| Weekly | 4% | -7% | -2% |
S&P 500 DAILY CHART
EDUCATION TOOLS FOR TRADERS
- Are you just getting started? Download the beginners’ guide for FX traders
- Would you like to know more about your trading personality? Take the DailyFX quiz and find out
- IG's client positioning data provides valuable information on market sentiment. Get your free guide on how to use this powerful trading indicator here.
---Written by Diego Colman, Market Strategist for DailyFX


