


US STOCKS OUTLOOK:
- The S&P 500, the Nasdaq 100 and the Dow Jones trade lower at the start of the week
- Fed officials signal that the tightening cycle may have to be aggressive to restore price stability, sparking a sharp increase in Treasury yields and weighing on sentiment
- In this article we explore key technical levels for the S&P 500 and the Nasdaq 100
Trade Smarter - Sign up for the DailyFX Newsletter
Receive timely and compelling market commentary from the DailyFX team
Most read: Crude Oil Price Forecast: Surge as EU Weighs Russia Oil Ban – What’s Next?
After notching their best 5-day performance since November 2020 last week, U.S. stocks were subdued on Monday, swinging between gains and losses, in a volatile session amid monetary policy jitters. At the market close, the S&P 500 fell modestly 0.04% to 4,461, pulling back from its best levels in more than a month, reached shortly after the opening bell. The Dow Jones also retreated, sliding 0.58% to 34,552 and ending an eight-day winning streak. For its part, the Nasdaq 100 fell 0.31% to 14,376, dragged down by a substantial rise in bond rates.
During regular trading hours, the U.S. Treasury curve shifted upward across maturities, with the 2- and 10-year yieldssoaring to 2.13% and 2.32%, respectively, their highest levels since May 2019. The European session saw yields drift higher on the back a strong rally in oil prices, but this upswing was later reinforced by central bank commentary.

In a speech to the National Association of Business Economics, Atlanta Fed President Raphael Bostic said he is prepared to raise borrowing costs above the neutral level and favors moving faster on balance sheet reduction. FOMC Chairman Powell added fuel to the fire and acknowledged that policymakers could raise the federal funds rate by more than the standard 25 bp hike in the future if warranted to restore price stability.Immediately after these remarks, Wall Street began pricing 40 bps of tightening for the May FOMC meeting.
While the normalization cycle roadmap could change depending on inflation developments in the coming months, overly restrictive monetary policy is likely to slow GDP growth and, in the worst case, tip the economy into recession. Bond traders appear to be positioning for this outcome slowly, with the 2s10s curve registering its narrowest spread since March 2020 and only 19 basis points away from inversion, an event that tends to presage an economic downturn.
At this point, there is no reason to panic or head for the exits just yet, but traders should be aware that during contractionary periods, the S&P 500 falls on average ~30% from peak to trough, with EPS declining approximately 15% for the group.
The broader picture could become even murkier if geopolitical risks do not dissipate soon. In this regard, the longer the Russia-Ukraine war drags on, the greater the negative impact on the global recovery and inflation, more so if commodity trade flows are further disrupted and/or other nations are drawn into the ongoing military conflict. Although ceasefire and peace talks are underway between Kyiv and Moscow, there is no solid evidence that negotiations are progressing favorably at this time, a a sign that the crisis could extend into April.
| Change in | Longs | Shorts | OI |
| Daily | -1% | -2% | -2% |
| Weekly | 33% | -22% | -3% |
S&P 500 TECHNICAL ANALYSIS
After last week’s strong rally, the S&P 500 failed to follow through on the topside on Monday, with price rejected lower from the 4,470 area, a key resistance created by the 200-day simple moving average and the 50% Fibonacci retracement of the 2022 correction. Having said that, if sellers regain decisive control of the market in the coming sessions, the first support to consider rests at 4,385, but if this barrier is breached, a retest of 4,300 becomes more likely. On the flip side, if S&P 500 resumes its recovery and manages to clear the 4,470 hurdle, buying-interest could pick up pace, paving the way for a move towards 4,551, the 61.8% Fib level.
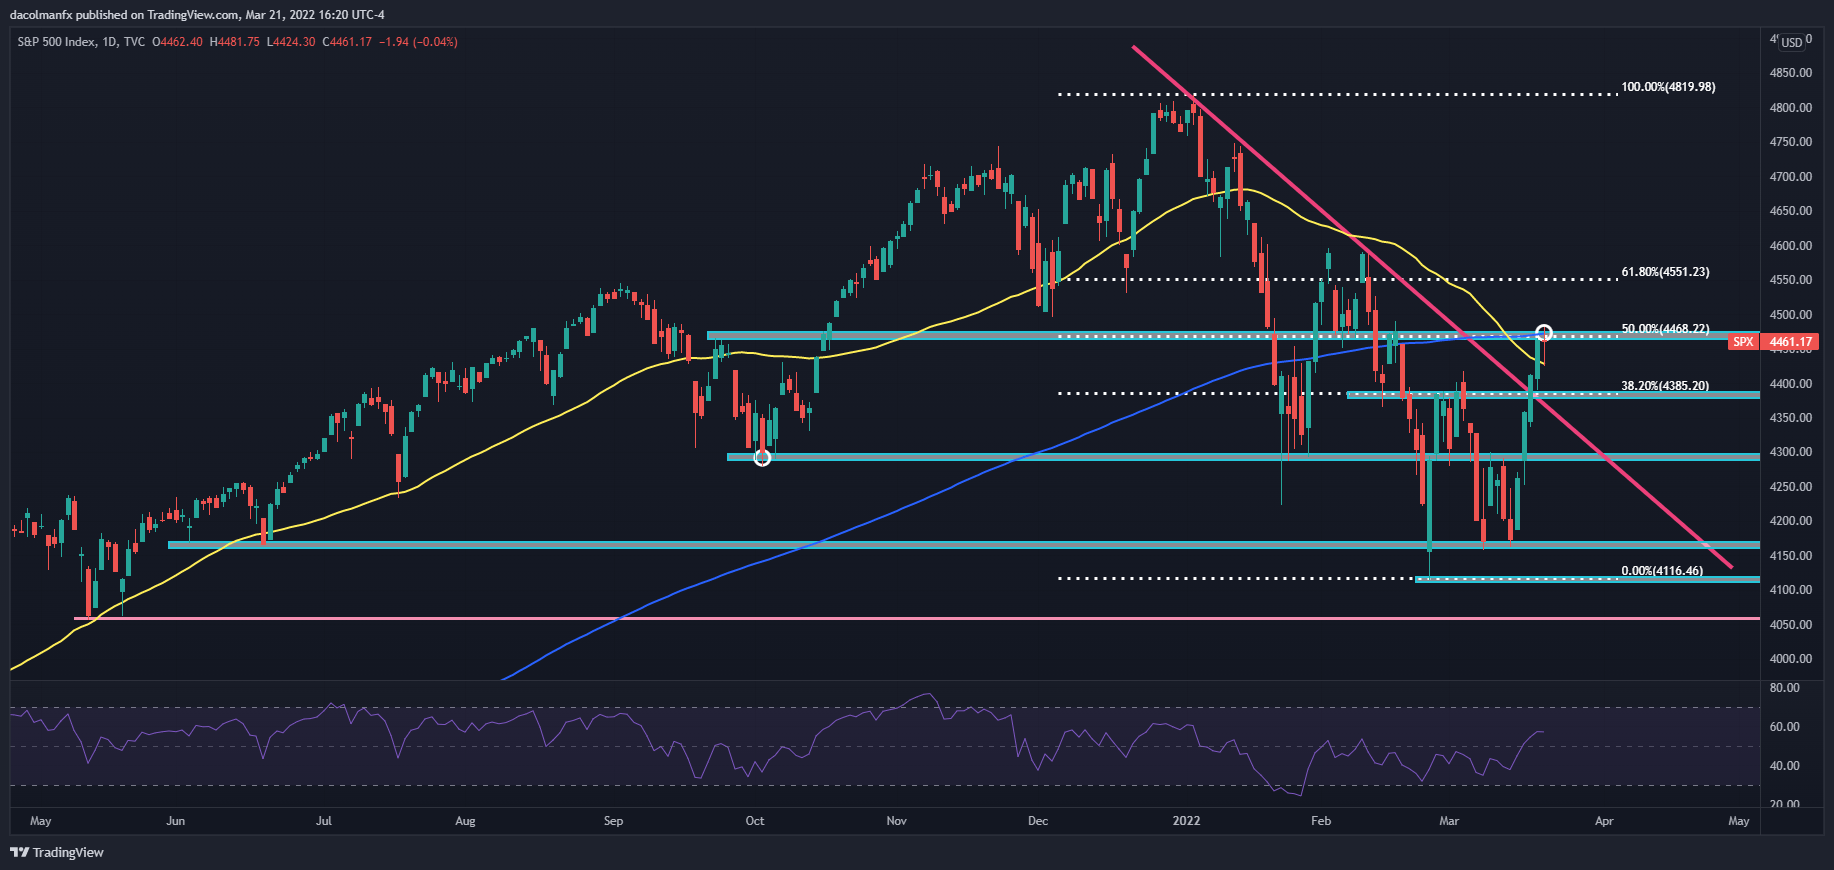
S&P 500 (SPX) Chart by TradingView
NASDAQ 100 TECHNICAL ANALYSIS
The Nasdaq 100’s positive momentum faded after the index failed to clear technical resistance in the 14,390/14,458 zone. If bearish pressure builds, the tech index could drift towards support at 14,080, though a drop below this floor could accelerate the decline and expose the 13,740 region. On the other hand, if sentiment improves and buyers return, we’d need to see a climb atop 14,390/14,458 to show more confidence in the rebound. Should this scenario play out, the Nasdaq 100 could be on its way to challenge 14,901, the 50% Fibonacci retracement of the November 2021-March 2020 sell-off.
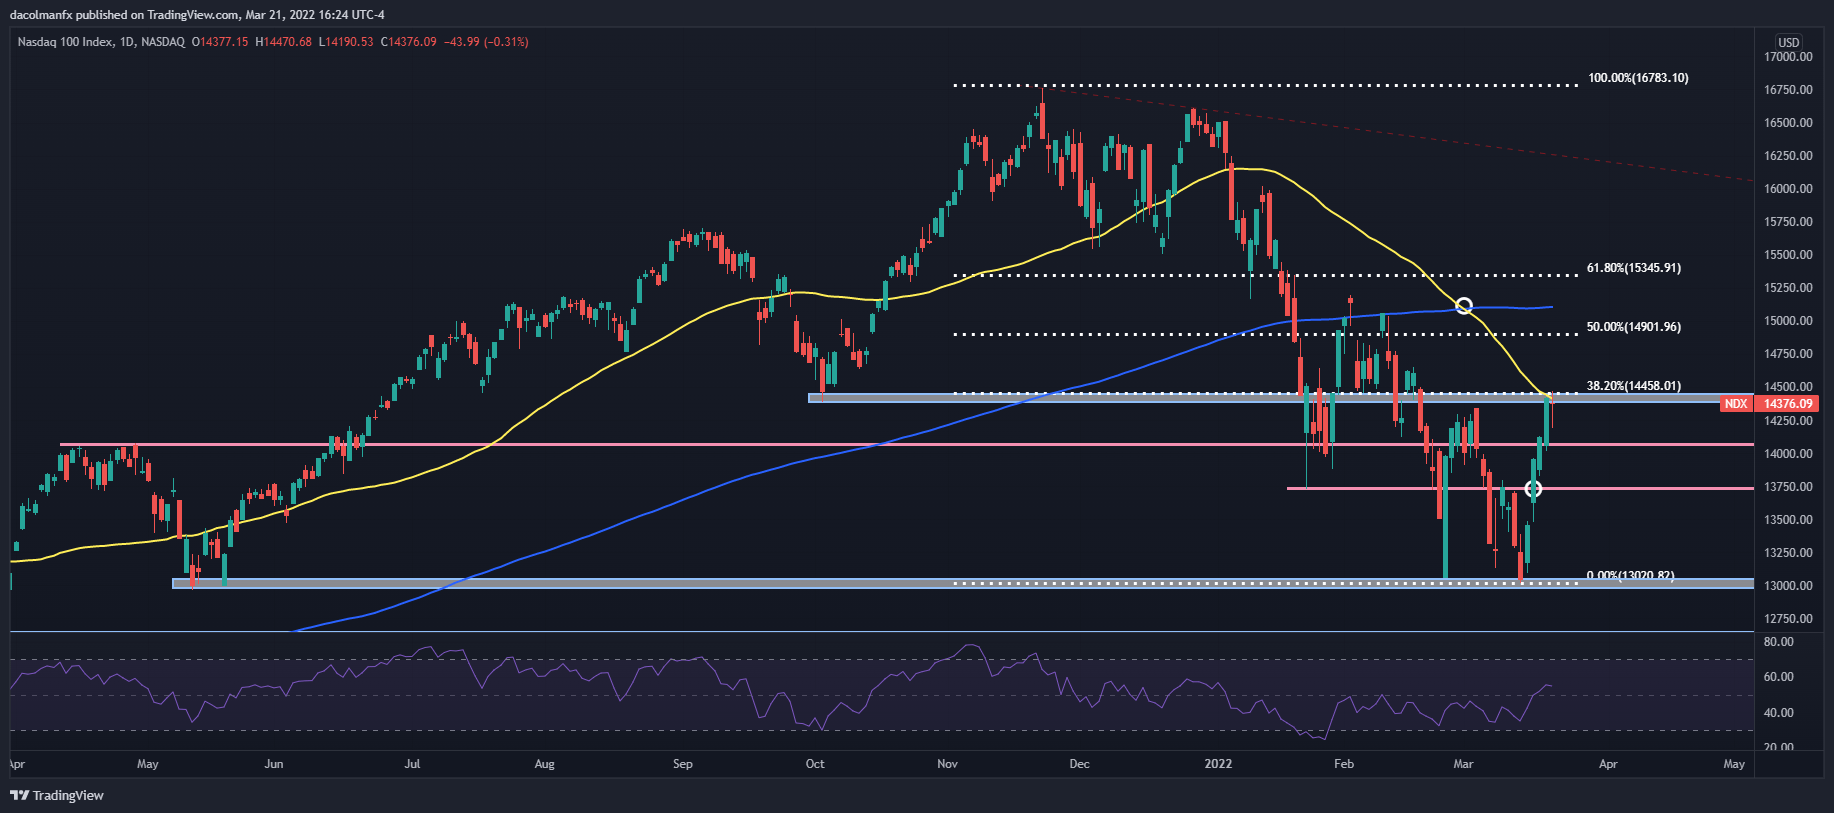
Nasdaq 100 (NDX) chart prepared in TradingView
EDUCATION TOOLS FOR TRADERS
- Are you just getting started? Download the beginners’ guide for FX traders
- Would you like to know more about your trading personality? Take the DailyFX quiz and find out
- IG's client positioning data provides valuable information on market sentiment. Get your free guide on how to use this powerful trading indicator here.
---Written by Diego Colman, Contributor


