


US STOCKS OUTLOOK:
- The S&P 500 rises for the third consecutive day and breaks above a key technical resistance zone
- The Nasdaq 100 rises 1.16% and accumulates an 8.2% advance in the last three session
- The Dow Jones also performs well and climbs to its highest level since February 17
Trade Smarter - Sign up for the DailyFX Newsletter
Receive timely and compelling market commentary from the DailyFX team
Most read: S&P 500, Dow Jones Technical Outlook - Will Bullish Momentum Fade?
After struggling for direction for most of the morning, U.S. stocks rallied in the afternoon trade and built on the recent monster surge as investors continued to digest the implications of the Fed's monetary policy outlook and welcomed news that Russia has avoided a sovereign default.
At the closing bell, the S&P 500 jumped 1.23% to 4,411 and extended its advance for the third day in a row, helped in part by reduced investor fear, with the VIX pushing steadily towards 25 after hovering above the 30-handle for the first two weeks in March. The Dow Jones also powered higher, soaring 1.23% to 34,480, its highest level in a month. The Nasdaq 100, for its part, soared 1.16% to 14,118, rebounding almost 8.2% from Monday’s low, a sign that sentiment is on the mend.
Today’s gains in the equity space come after the Federal Reserve raised interest rates off the zero bound by 25 basis points yesterday and signaled six more rate hikes for this year and two for 2023. While the normalization cycle is undisputable hawkish, Wall Street appeared to have taken solace in policymakers’ iron-clad resolve to control inflation; after all, price stability will be beneficial for the economy and corporate margins in the long run.

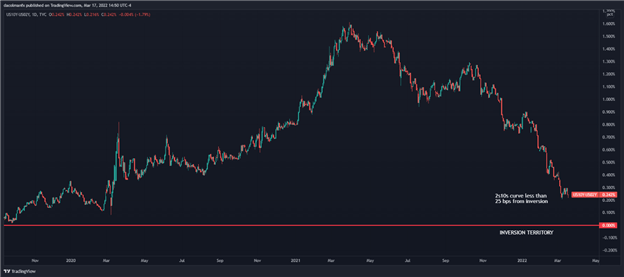
It is too early to tell whether the U.S. central bank will manage to engineer a soft landing with excessive tightening on the horizon, but the bond market is not overly optimistic, with the 2s10s spread in a persistent flattening trend and only 23 basis points away from inverting. A sustained inversion in this part of the yield curve tends to signal a recession, a scenario that could spook investors and fuel higher levels of volatility. Having said that, we should continue to watch how the Treasury curve behaves in the coming days and weeks to better position for what lies ahead.
US YIELD CURVE (2-10 YEAR SPREAD)
Focusing on other catalysts for price action, geopolitical risks have not dissipated, they have simply taken a back seat to the Fed momentarily. There has been a lot of conflicting information and headlines regarding the Russia-Ukraine crisis, but Western intelligence suggests that there is still a very large gap between Moscow and Kiev's positions, a sign that a peace deal may still be a long way off. Needless to say, the longer the war drags on, the greater the negative impact on global growth and inflation, even more so if commodity trade flows are further disrupted and/or other countries are drawn into the military conflict.
| Change in | Longs | Shorts | OI |
| Daily | 1% | -5% | -2% |
| Weekly | 34% | -20% | -1% |
S&P 500 TECHNICAL ANALYSIS
At the time of writing, the S&P 500 has pierced trendline resistance and a key Fib level near 4,385. If the breakout is confirmed with a follow-through to the upside in the coming days, buyers could launch on attack on 4,468, a ceiling defined by the 50% Fibonacci retracement of the 2022 correction and the 200-day SMA. On the other hand, if traders start to fade the recent rally and the index pivots lower, the first support to consider appears at 4,290 and then 4,225.
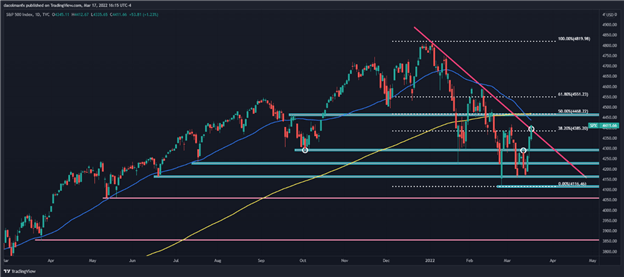
S&P 500 (SPX) Chart by TradingView
NASDAQ 100 TECHNICAL ANALYSIS
The Nasdaq 100 has rallied forcefully in recent days and now trades above the 14,000 psychological level. If bulls manage to drive the index higher in the coming sessions, buying interest could pick up pace, paving the way for a move towards 14,458, the 38.2% Fibonacci retracement of the November 2021/March 2022 sell-off. On the flip side, if the Nasdaq 100 is rejected from current levels and resumes its decline, support lies at 13,740 and then the 2022 low around the 13,000-mark.
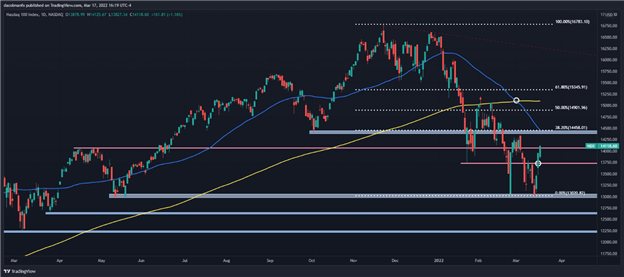
Nasdaq 100 (NDX) chart prepared in TradingView
EDUCATION TOOLS FOR TRADERS
- Are you just getting started? Download the beginners’ guide for FX traders
- Would you like to know more about your trading personality? Take the DailyFX quiz and find out
- IG's client positioning data provides valuable information on market sentiment. Get your free guide on how to use this powerful trading indicator here.
---Written by Diego Colman, Contributor


