


US STOCKS OUTLOOK:
- S&P 500 falls for third consecutive day, Dow Jones ends the day flat
- Nasdaq 100 sinks to new 2022 lows as U.S. Treasury rates soar ahead of the FOMC decision
- Lack of positive developments on the geopolitical front (Russia-Ukraine war) weighs on confidence
Trade Smarter - Sign up for the DailyFX Newsletter
Receive timely and compelling market commentary from the DailyFX team
Most Read: Dow, S&P 500, Nasdaq 100 Forecasts: Stuck at Support for Lift-Off
U.S. stocks sold off at the start of the week, dragged down by rising bond yields and the absence of encouraging developments on the geopolitical front as it relates to the Russia-Ukraine war. At the market close, the S&P 500 was down 0.74% to 4,173, adding losses for the third consecutive day, amid investor caution ahead of the FOMC announcement. The Dow Jones, for its part, remained flat and ended the day at 32,945. Meanwhile, the Nasdaq 100 plunged 1.92%, closing in bear-market territory at 13,046, its lowest level in 2022, amid widespread weakness in the technology sector.
During the session, U.S. Treasury rates rose across the curve on expectations that the Russia-Ukraine conflict will not derail the Federal Reserve's plans to normalize monetary policy and raise interest rates several times this year starting at this week's FOMC meeting. In fact, Fed-linked swaps moved to fully price seven standard rate hikes by 2022, up from six last week. Against this backdrop, the 2-year yield jumped 10bs to 1.85%, its highest level since July 2019. The 10-year yield also moved higher, soaring 14bp to 2.14%, a level not seen in nearly three years.

Higher borrowing costs pressure equity valuations by increasing the rate at which future cash flows are discounted. Tech stocks are particularly sensitive to rising yields because their value rests heavily on future earnings. It is therefore not surprising that the Nasdaq 100 was the weakest of its major peers on Monday.
Looking ahead, apart from the Fed's tightening cycle, geopolitical tensions in Eastern Europe are another headwind for risk assets. The longer the war in Ukraine drags on, the greater the negative impact on global growth and inflation. The U.S. economy remains on a somewhat healthy footing, but if the outlook continues to worsen as it has recently, stagflation could become a reality. Obviously, this would be a bad outcome for corporate earnings and thus for the stock market as a whole.
NASDAQ 100 TECHNICAL ANALYSIS
After a sharp pullback at the start of the week, the Nasdaq 100 retested the February lows and briefly set a new lower low, but was unable to break below the 13,000 psychological level, a key support area. However, if this floor were to be breached in the coming sessions, selling momentum could intensify, paving the way for a move towards 12,618 and then 12,225. On the other hand, if dip buyers return and spark a bullish reversal, the first resistance to consider appears at 13,735, followed by 14,050.
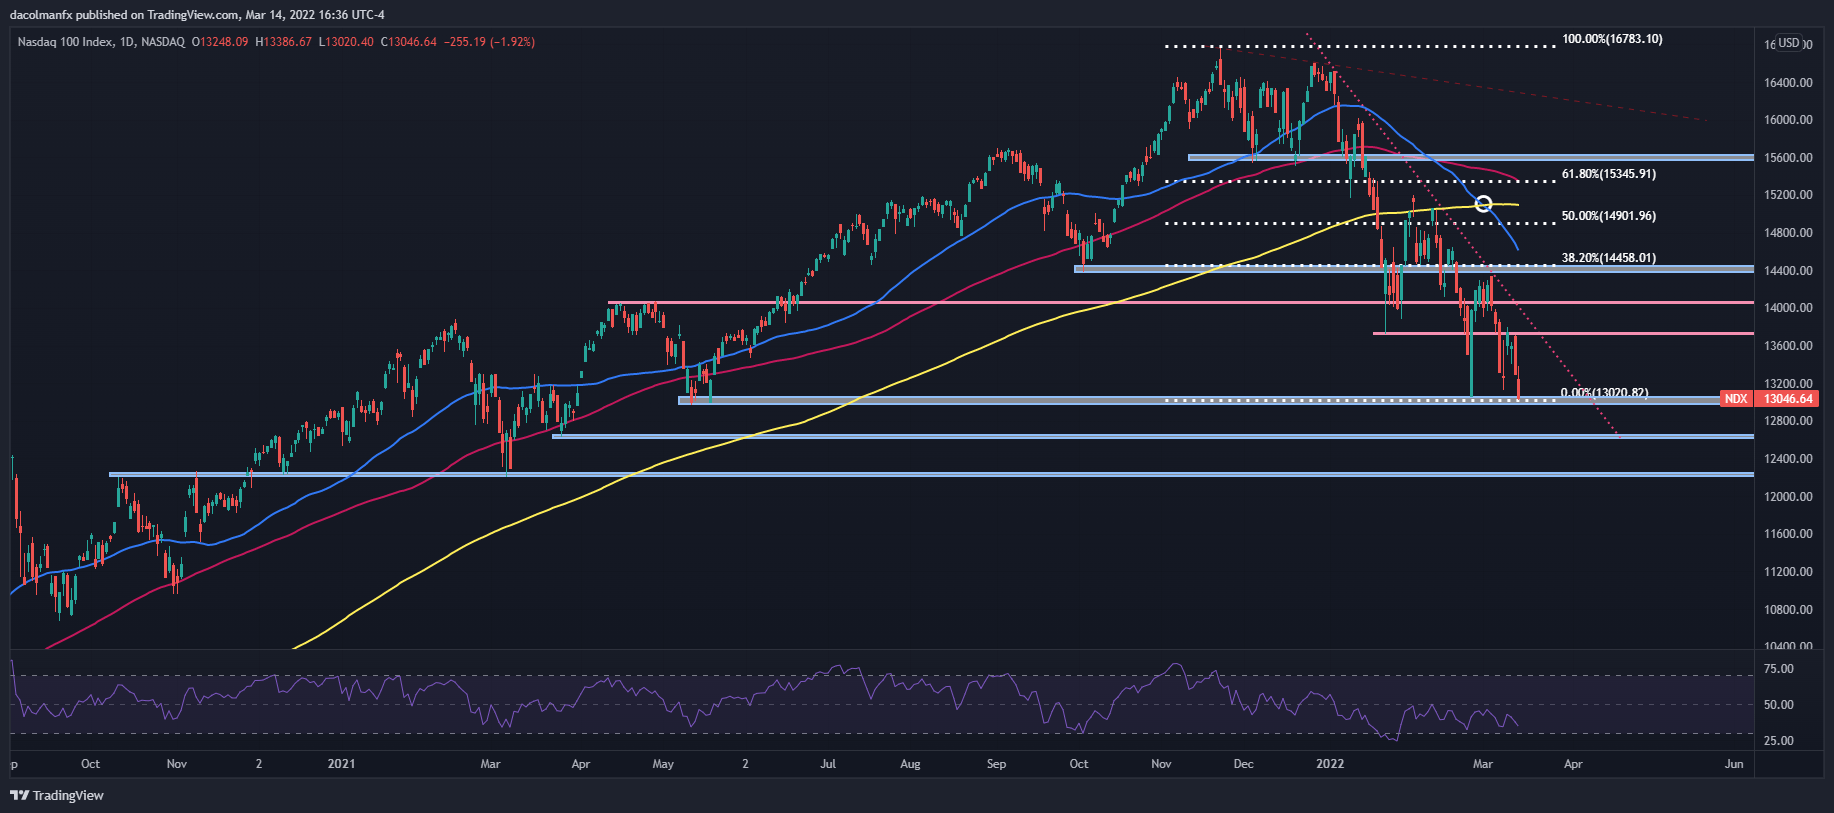
Nasdaq 100 (NDX) chart prepared in TradingView
| Change in | Longs | Shorts | OI |
| Daily | 7% | -6% | -1% |
| Weekly | 11% | -17% | -7% |
S&P 500 TECHNICAL ANALYSIS
While the S&P 500 has not yet retested its 2022 lows, it still maintains its negative outlook, in fact, technical signals are growing increasingly bearish amid the development of a death-cross on the daily chart (The Nasdaq 100 has dropped more than 7% after this pattern was confirmed earlier this month). If we see additional losses in the coming days, support lies at 4,160, but more importantly 4,115. If sellers manage to take out this last level, the S&P 500 could extend its recent decline and retreat towards the May 2021 low at 4,060. Alternatively, if the index begins to recover and prices charge higher, resistance lies at 4,225, followed by 4,285.

S&P 500 (SPX) Chart by TradingView
EDUCATION TOOLS FOR TRADERS
- Are you just getting started? Download the beginners’ guide for FX traders
- Would you like to know more about your trading personality? Take the DailyFX quiz and find out
- IG's client positioning data provides valuable information on market sentiment. Get your free guide on how to use this powerful trading indicator here.
---Written by Diego Colman, Contributor


