S&P 500 OUTLOOK:
- The S&P 500 and the Nasdaq 100 set another record close on Thursday
- Falling yields across the U.S. Treasury curve after the Federal Reserve adopted a dovish stance toward premature rate hikes boosts risk appetite
- The October NFP report will take center stage on Friday. The labor market must show marked improvement for bullish sentiment to remain elevated
Trade Smarter - Sign up for the DailyFX Newsletter
Receive timely and compelling market commentary from the DailyFX team
Most read: What is the Non-Farm Payroll Report (NFP) and How to Trade It?
Bullish sentiment prevailed on Wall Street Thursday, although buying momentum slowed slightly as traders grew more cautious about the equity market rally amid non-stop gains and signs of exuberance in recent days. At the end of the trading session, the S&P 500 rose 0.42% to 4,680 while the Nasdaq 100 popped 1.25% to 16,346, a record close in both cases. The advance for the senior indices were partially fueled by falling rates across the U.S. Treasury curve after the Federal Reserve embraced a dovish stance at its November monetary policy meeting, signaling that it will not rush to raise borrowing costs despite elevated inflationary pressures.
Accommodative monetary policy, strong corporate earnings, some positive seasonality and improving economic data in the services sector have all aligned to create a very benign environment for risk assets of late. These factors have helped propel major U.S. stock indices to record highs, even in the face of heightened uncertainty such as supply chain issues.


However, for risk-on mood to continue, the U.S. recovery will need to gather more strength to support equity valuations. That said, investors will get a better picture of the health of the economy on Friday, when the U.S. Labor Department releases its October nonfarm payrolls (NFP) report. After weak numbers in September, traders expect to see 450,000 new jobs, although we will likely need a figure well above 500,000 to maintain momentum and revive confidence in the rebound.
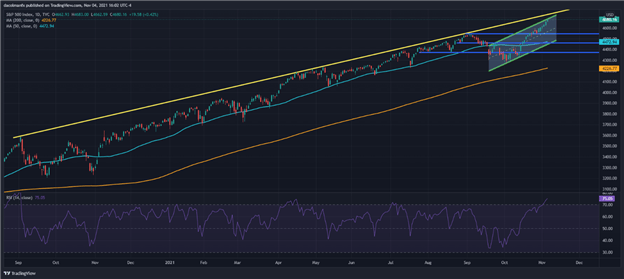
If the NFP results surprise to the upside, stocks may have margin to run higher over the medium term, but it is important to underscore a crucial point: the market is becoming increasingly overbought. For example, in the last 17 trading days, the S&P 500 only fell twice; all the remaining sessions were positive. In addition, its 14-period RSI has moved above 70 for the first time since early July. At that time, when the oscillator reached an extreme overbought reading, we saw a 3.5% drop shortly thereafter. Past performance is not an indicator of future outcomes, but the exuberance certainly invites caution; after all, no bull market ever follows a straight line.
From a technical standpoint, the S&P 500 continues to approach the upper boundary of a short-term channel near 4,690 following recent gains. Given the index's proximity to key resistance and its overbought condition, transitory weakness should not be ruled out. Having said that, in the event of a pullback, traders should look for support at 4,550, although a move below this floor could pave the way for a decline towards 4,460.
On the other hand, if the upward momentum does not cool and the S&P 500 rises further, the first resistance to consider appears at 4,690. If bulls manage to take out this ceiling, we could see a rally towards 4,725 before the buying pressure starts to weaken.
| Change in | Longs | Shorts | OI |
| Daily | 0% | -6% | -3% |
| Weekly | 0% | -9% | -5% |
S&P 500 TECHNICAL CHART

Source: TradingView
EDUCATION TOOLS FOR TRADERS
- Are you just getting started? Download the beginners’ guide for FX traders
- Would you like to know more about your trading personality? Take the DailyFX quiz and find out
- IG's client positioning data provides valuable information on market sentiment. Get your free guide on how to use this powerful trading indicator here.
---Written by Diego Colman, Contributor


