


US STOCKS TALKING POINTS:
- After a weak open, U.S. stocks manage to recover on news that the US Senate may reach a deal to raise the debt-ceiling
- S&P 500, Dow Jones, and Nasdaq 100 eke out small gains, but the Russell 2000 finishes in negative territory
- Traders will now turn their attention to the NFP report set to be released Friday
Trade Smarter - Sign up for the DailyFX Newsletter
Receive timely and compelling market commentary from the DailyFX team
Most read: Bitcoin Soars into October – Breakout Levels to Consider
U.S. stocks opened with large losses on Wednesday on taper fears and concerns over a possible U.S. default amid gridlock in Washington to raise the federal government’s borrowing authority. However, selling pressure diminished and risk appetite rebounded in the afternoon after the Senate Minority Leader, Mitch McConnell, offered a short-term debt limit extension deal to avert a catastrophic national default.
After a tug of war between bears and bulls, the major equity indices closed marginally higher, with the S&P 500, Dow Jones, and Nasdaq 100 climbing 0.4%, 0.3% and 0.6% respectively in a session characterized by high volatility. Meanwhile, the Russell 2000 was unable to recoup earlier losses and finished the day in negative territory, sliding 0.6% to 2214, but off its daily lows.
With a possible agreement to raise the debt limit between Democrats and Republicans in Congress, investors will now turn their attention to the September labor market data due later this week. Expectations are high after the ADP report beat forecasts this morning, showing 568,000 jobs created by the private sector versus an estimate of 428,000.
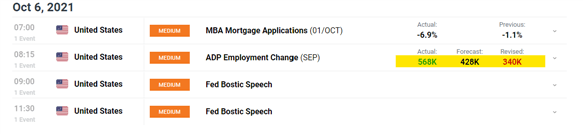
Source: DailyFX Economic Calendar
Focusing on the ADP numbers, the data revealed a robust recovery in business services employment, a sign that hiring may be normalizing in high-contact sectors after a weak summer on the back of delta-variant anxiety. This may pave the way for a strong NFP print on Friday. A good non-farm payroll report will seal the deal on a November tapering announcement, accelerating the transition towards higher rates in the long end of the Treasury curve.
The process to begin tapering asset purchases has been well choreographed by the central bank, so it is unlikely to be a significant source of panic selling or a major market shock, but it could certainly trigger volatility if nominal yields rise too much too quickly in response to policy normalization. As we saw in March and earlier this month, a rapid upward move in rates can be detrimental to stocks, particularly those in the technology sector.

RUSSELL 2000 TECHNICAL ANALYSIS
The Russell 2000 has been in a consolidation phase since mid-August, setting lower highs and higher lows impeccably and trading inside what appears to be a symmetrical triangle, a pattern that can be bullish or bearish from a technical point of view.
For the bearish scenario to play out, price would need to break below the triangle support, now near 2196/2185 (in this area, we also have the 38.2% Fib retracement of the 2021 rally). If bears manage to push the small-cap index below this level, the 2091 area would become the immediate downside focus, followed by 2034.
On the other hand, for bullish resolution to materialize, price must climb towards the triangle upper boundary and breach this resistance decisively (2275). If this happens, the Russell 2000 could be on its way to retest its record highs.
RUSSELL 2000 DAILY CHART
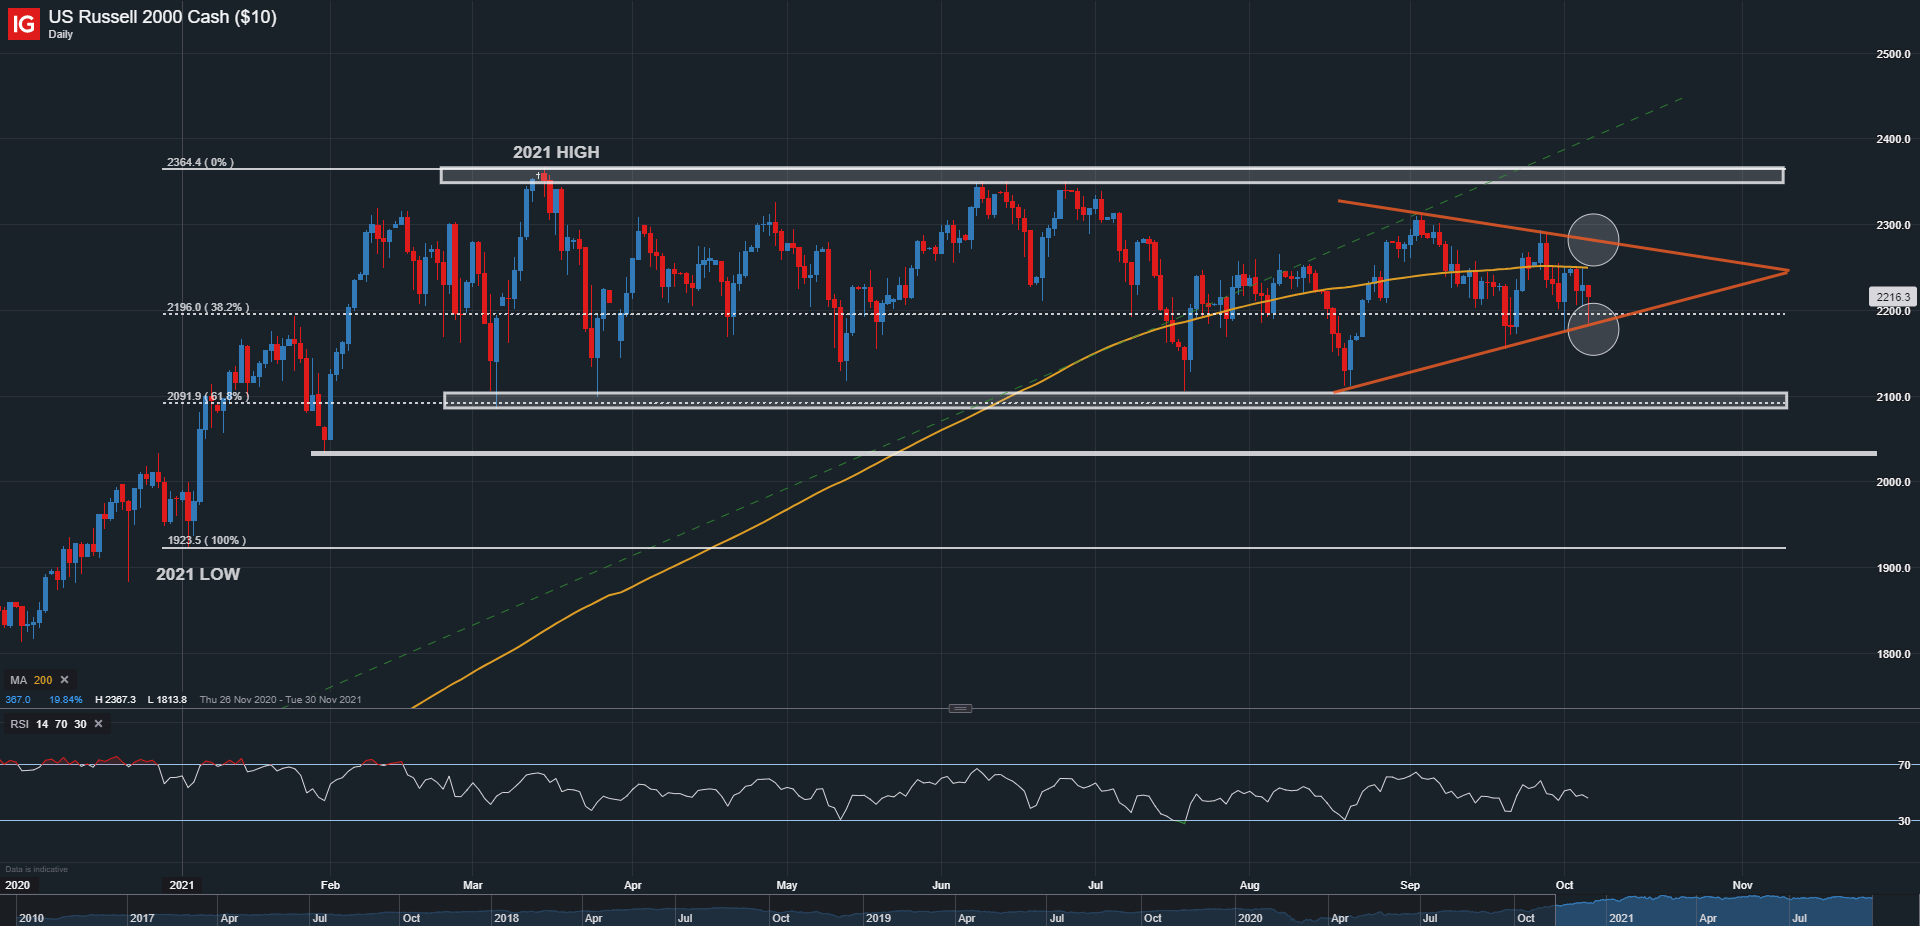
Source: IG Trading Platform
EDUCATION TOOLS FOR TRADERS
- Are you just getting started? Download our beginners’ guide for FX traders
- Would you like to know more about your trading personality? Take our quiz and find out
- IG's client positioning data provides valuable information on market sentiment. Get your free guide on how to use this powerful trading indicator here.
- Subscribe to the DailyFX Newsletter for weekly market updates and insightful analysis
---Written by Diego Colman, Contributor


