


Copper Price Outlook:
- Copper prices are quickly heading back towards their August low – and perhaps lower.
- Copper demand continues to outstrip supply, according to the recent update from the International Copper Study Group.
- However, speculation around China’s Evergrande and what it may mean for Chinese property development is punishing copper prices in the near-term.

All About Evergrande
In the late-August copper price forecast update it was noted that “the shifting narrative around the supply-demand picture has created an opportunity whereby copper traders may be able to retake the pandemic uptrend, which would keep intact the prospect of a multi-month bull flag forming – and if viable, another jaunt to all-time highs.”
Copper prices were never able to retake the pandemic uptrend. Instead, besieged by news out of China that its second largest property developer, Evergrande, was facing the threat of default, markets have pushed copper back towards its August low.
The simple truth of the matter is that near-term speculation around China and the future of property development in the world’s second largest economy – and the largest consumer of copper – is trumping any other sort of good news that would normally bolster copper prices.
In fact, just yesterday, the International Copper Study Group’s (ICSG) latest bulletin showed that the copper market showed a 90,000 tons deficit in June, compared with a 4,000 tons surplus in May. Per the bulletin, through the first half of 2021, the market was in a 2,000 tons deficit compared with a 67,000 tons surplus in the same period a year earlier.
Until news around China’s Evergrande and the broader Chinese property development sector is on a path towards resolution that doesn’t provoke fear of economic and financial contagion, copper prices may be in volatile, difficult trading over the coming weeks.

COPPER PRICE TECHNICAL ANALYSIS: DAILY CHART (March 2020 to September 2021) (CHART 1)
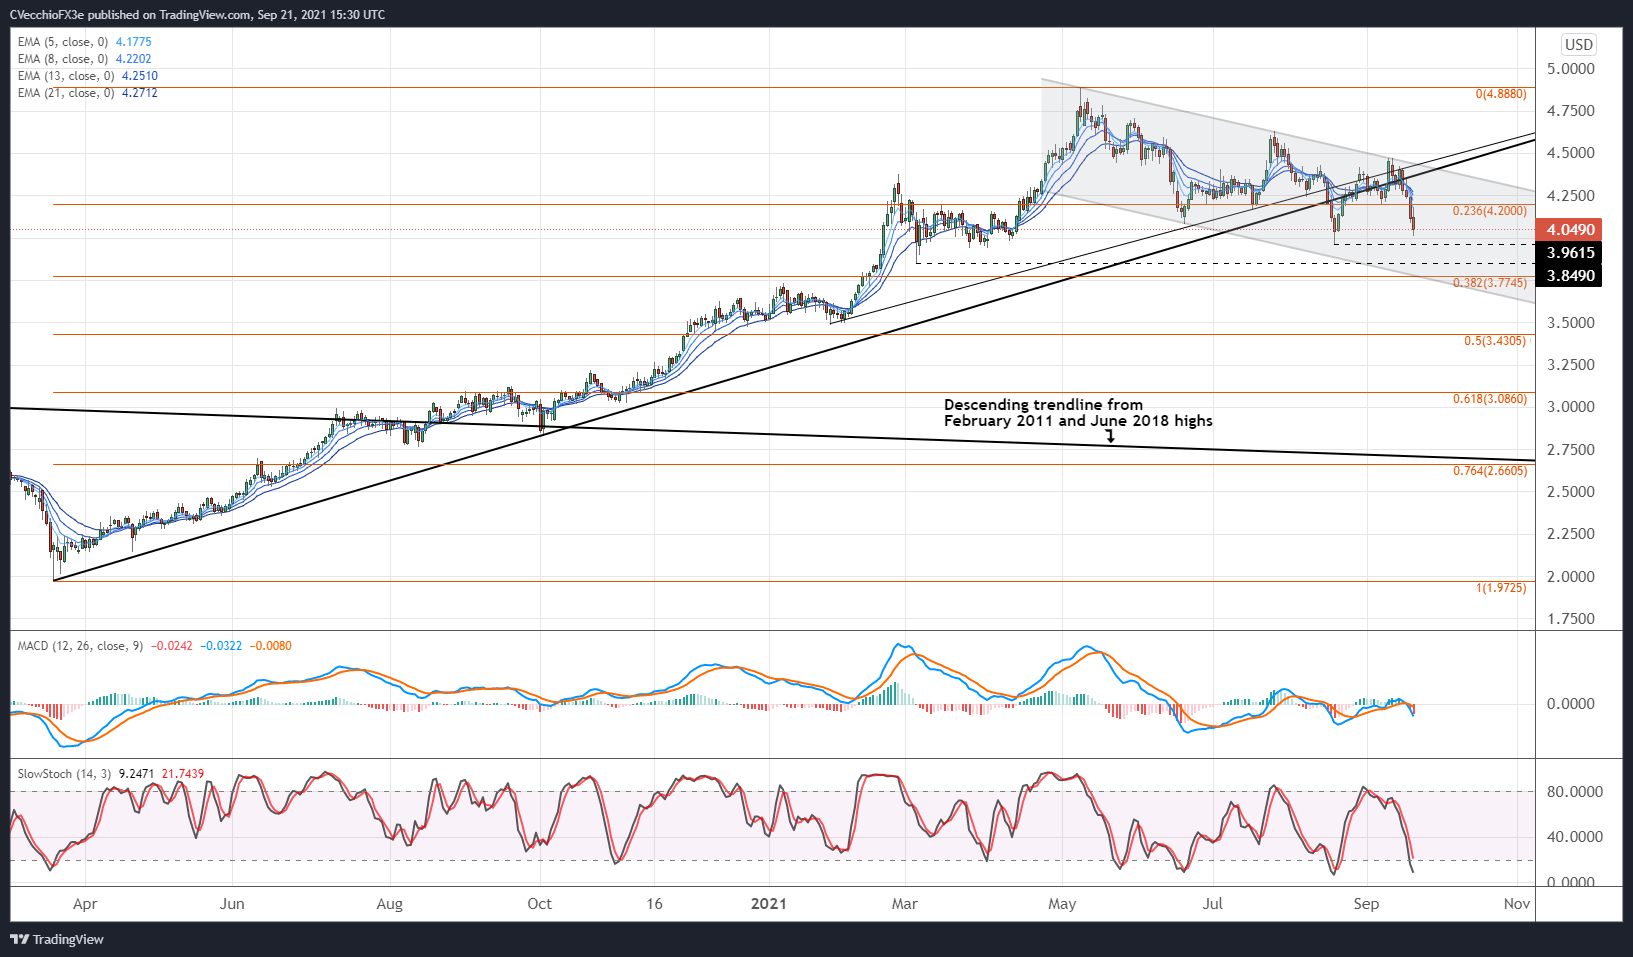
Last month it was noted that “the line in the sand is clear for copper prices in the near-term: 4.2700 by the end of August. By reclaiming said figure before month’s end, copper prices would be back above their pandemic uptrend, suggesting that a false bearish breakout had transpired.” However, copper prices were unable to maintain a move back above the pandemic trendline, instead collapsing below the 23.6% Fibonacci retracement of the 2020 low/2021 high range at 4.2000.
Momentum indicators have turned sharply lower. Copper prices are below their daily 5-, 8-, 13-, and 21-EMA envelope, which is in bearish sequential order. In recent days, daily MACD has crossed below its signal line into bearish territory, while daily Slow Stochastics are just arriving in oversold territory.
While the multi-month bull flag is still technically intact, it may be more appropriate to view price action as transpiring within a descending channel – which means more downside may still persist. A return to the August low at 3.9615 isn’t out of the question, nor is a deeper setback towards the March swing low at 3.8490.
COPPER PRICE TECHNICAL ANALYSIS: WEEKLY CHART (November 2008 to September 2021) (CHART 2)

As has noted in August, “a return to a bullish bias for copper prices may soon be around the corner – if 4.5000 is achieved.” Despite attempting at retaking the pandemic uptrend, the 4.5000 level was never achieved, and copper prices instead of plunged back towards the August low. Weekly momentum indicators continue to sag, even though they’re not quite in bearish territory just yet: weekly MACD is trending lower but remains above its signal line; and weekly Slow Stochastics have turned lower at their median line. Continued losses can’t ruled out henceforth.

--- Written by Christopher Vecchio, CFA, Senior Currency Strategist


