


NASDAQ 100 OUTLOOK:
- Nasdaq 100 begins September on the right foot and notches a record closing high after a 4.16% gain in August
- Depressed Treasury yields following the ADP employment report boost appetite for technology stocks
- Despite positive investor sentiment, downside risks for equity markets continue to build in the near term
Most read: Nasdaq 100 Technical Forecast for the Days Ahead
The Nasdaq 100 started September on the right foot, rising 0.2% to 15,611, a record closing high, after ending the entire month of August with a gain of 4.16%.
The tech index was mainly lifted by Apple, Amazon and Facebook in the midst of depressed U.S. Treasury yields as a result of disappointing ADP employment data, which showed that the private sector created only 374,000 jobs last month, well below expectations of 625,000 payrolls.
Traders speculated that weak labor market results would convince skeptics and inflation hawks at the Fed to wait more, perhaps until December or even longer, before launching a scheme to start reducing the pace of asset purchases, a scenario that will likely slow the recovery of long term rates such as the 10-year yield.
In any case, ADP figures can sometimes be misleading when it comes to measuring the nation's employment trend, so traders should wait for the National Nonfarm Payrolls (NFP) survey before reaching any conclusions about the health of the labor market (for reference, the two reports diverged substantially in July, with the NFP tally at 943,000 versus ADP's 326,000).
Focusing on the upcoming NFP print, analysts expect to see 750,000 new jobs, with forecasts ranging from 450,000 to 950,000. Any figure close to one million could bring forward the Fed tapering timeline and weigh on the Nasdaq 100 while anything below 500,000 should be supportive of tech stocks, at least in the very short-term.
However, there is one key risk looming over equity markets in September: the prospect of higher corporate taxes. When Congress returns from summer recess in the coming weeks, Democrats will begin to put together their "$3.5 trillion human infrastructure package". The ambitious bill, which could pass via the budget reconciliation process without a single Republican vote sometime in the fall, will likely raise corporate taxes from 21% to 25% or, in the worst-case scenario, to 28%. As investors wake up to the possibility of detrimental tax reform, market sentiment could take a hit and trigger a large pull-back in risk assets.
Last but not least, another potential headwind for the Nasdaq is seasonality. Although past performance is not indicative of future results, September tends to be a disappointing month for stocks as investors cut positions to book profits. For this reason, the retail crowd should trade with caution and less complacency and prepare for the possibility of a normal technical correction in the not too distant future.

NASDAQ 100 TECHNICAL ANALYSIS
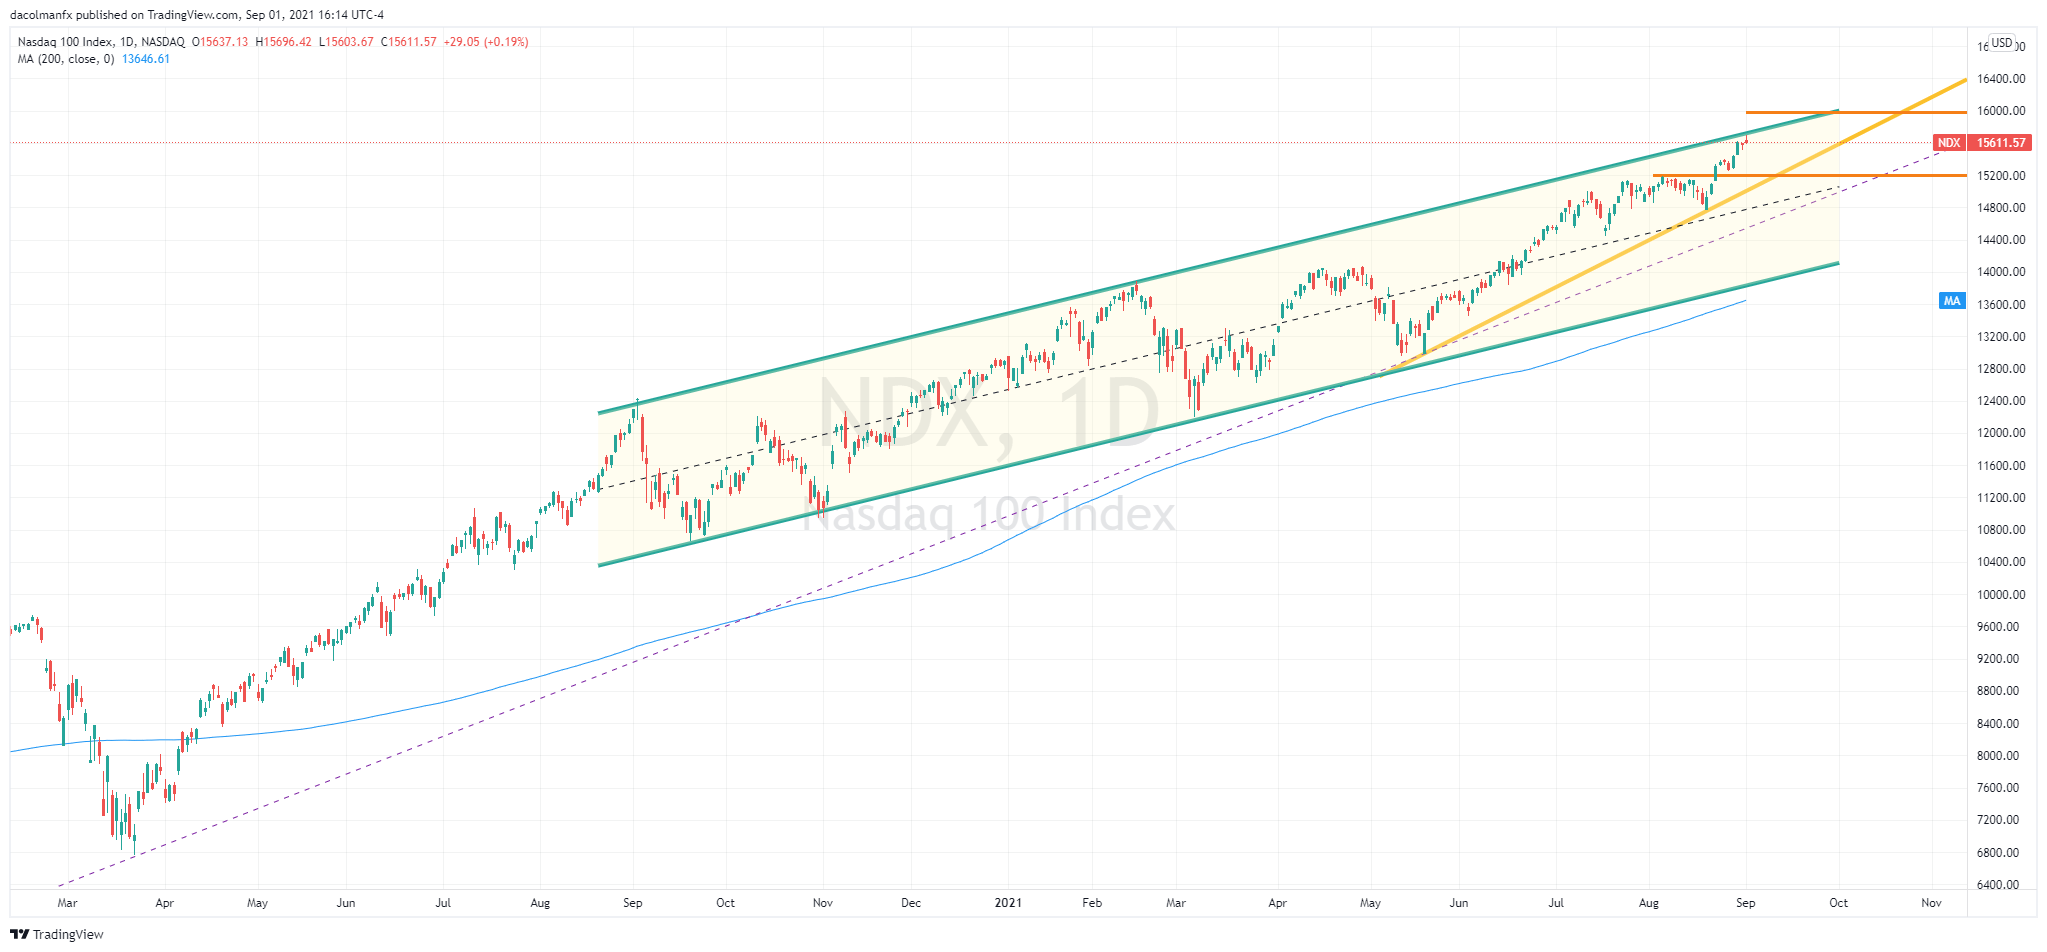
The Nasdaq 100 has traded within the confines of an impeccable ascending channel since September last year. After the latest leg higher, price is approaching the pattern’s upper boundary near 15,750, a key technical resistance. If bulls manage to pierce this barrier, we will find ourselves in uncharted territory, but a possible upside target to consider is the psychological mark of 16,000.
On the other hand, if bears regain the upper hand in the coming days, taking into account the overbought state of the market reflected by the RSI indicator, selling pressure could push the tech index towards the 15,200 support. If price falls below this level, there would be scope for a move towards 14,800.
NASDAQ 100 TECHNICAL CHART
EDUCATION TOOLS FOR TRADERS
- Are you just getting started? Download our beginners’ guide for FX traders
- Would you like to know more about your trading personality? Take our quiz and find out
- IG's client positioning data provides valuable information on market sentiment. Get your free guide on how to use this powerful trading indicator here.
- Subscribe to the DailyFX Newsletter for weekly market updates and insightful analysis
---Written by Diego Colman, DailyFX Market Strategist


