


ISM MANUFACTURING KEY POINTS:
- The Institute for Supply Management will publish on Thursday its June Manufacturing PMI report
- The market expects manufacturing activity to pull back slightly to 61, down from 61.2 in May. This rate of expansion would still represent above-trend growth
- A red-hot print, although good over the medium term, may trigger a bearish but transitory move in the S&P 500 as it may strengthen the case for monetary tightening
Most read: S&P 500 Rally to Extend on Red-Hot Consumer Confidence Data
The Institute for Supply Management will release its June manufacturing PMI survey on Thursday. The report will likely attract considerable attention, as it may shed light on the state of the recovery and whether or not supply bottlenecks are beginning to resolve, all as Fed officials begin to place more emphasis on realized economic progress.
Market expectations suggest that the goods-producing sector grew strongly for the 13th consecutive month, but slowed slightly to 61.00 from 61.2 in May. As a side note, any reading above 50 indicates economic expansion, while a print below that threshold signals contraction.

Source: DailyFX Economic Calendar
It is likely supply bottlenecks restrained some production and exacerbated the rise in input costs, but regional PMIs (Philly Fed, Richmond Fed surveys) and other preliminary data suggest manufacturing activity maintained some momentum relative to the previous month thanks to pent-up demand linked to the reopening of the economy. All of this points to above-trend expansion and some acceleration in GDP growth as the second quarter of 2021 wraps up.
| Change in | Longs | Shorts | OI |
| Daily | 0% | -6% | -3% |
| Weekly | 29% | -20% | -2% |
As for the ISM manufacturing subcomponents, the employment metric likely remained subdued due to labor constraints and struggles among companies to find suitable workers, while prices paid may have stayed elevated, but off their peaks, amid a pullback in some commodities from May's highs. Meanwhile, new orders should show broad-based strength in the midst of robust demand conditions, even as the services sector start to become the main growth catalyst.
Check out DailyFX Education and learn how ISM data can frequently cause market volatility
Generally speaking, a strong ISM manufacturing reading should bode well for risk-assets and, therefore, support the S&P 500. In fact, there is a very strong positive correlation between manufacturing output and S&P 500’s price action over the medium term (i.e. when the ISM manufacturing rises so does the S&P 500). However, at this juncture, a red hot print above forecasts could actually trigger a transitory bearish move in the stock market as humming growth will put pressure on the Fed to start charting an exit strategy from its quantitative easing program sooner rather than later. In the era of easy money, less monetary stimulus tends to mean lower equity prices.

The best outcome for bullish equity traders can hope for at this point is an in-line or slightly below expectations reading in the ISM report. Either result should be positive for risk-sentiment as they’d support a “tapering delay” and the "lower-for-longer" rate narrative, all without jeopardizing the steady economic recovery theme.
Turning our eyes to the greenback, a soft or a significant downside surprise in manufacturing activity may be bearish and fuel the next leg lower in the US dollar.
With the investors having priced in almost three rate increases by the end of 2023, any data disappointment is poised to have a disproportionately large negative impact on US currency.
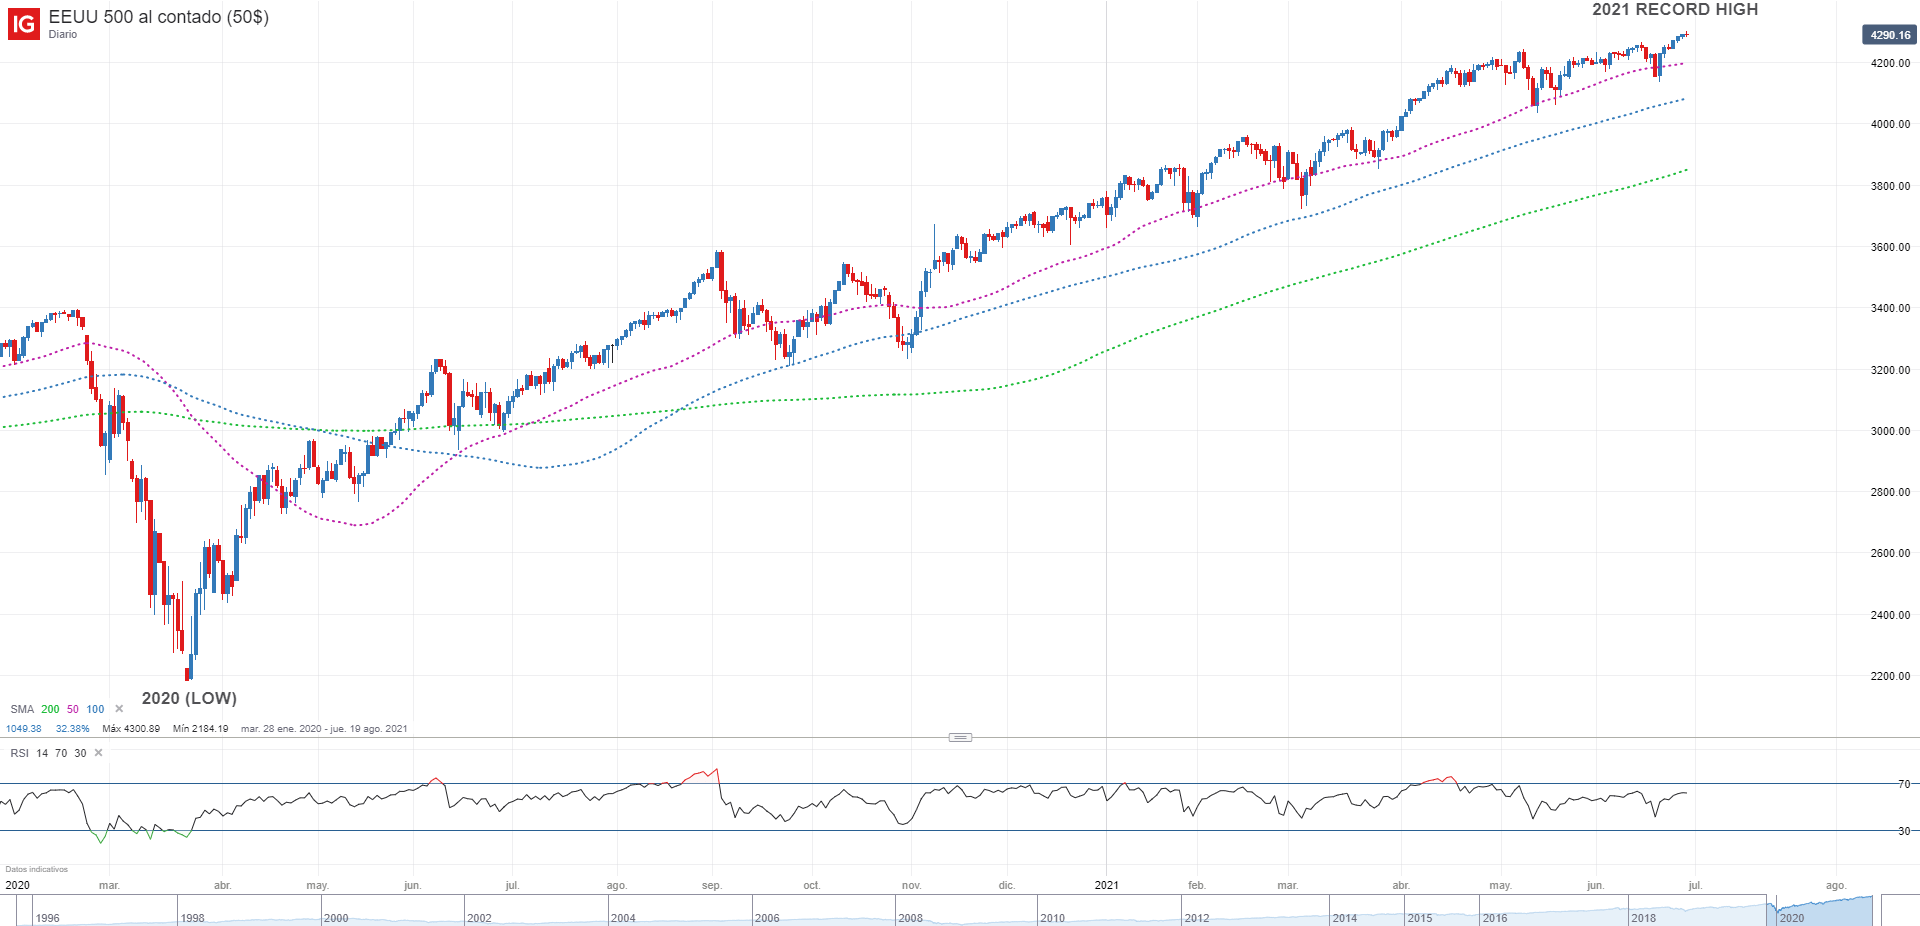
S&P 500 DAILY CHART
EDUCATION TOOLS FOR TRADERS
- Are you just getting started? Download our beginners’ guide for FX traders
- Would you like to know more about your trading personality? Take our quiz and find out
- IG's client positioning data provides valuable information on market sentiment. Get your free guide on how to use this powerful trading indicator here.
- Subscribe to the DailyFX Newsletter for weekly market updates and insightful analysis
---Written by Diego Colman, DailyFX Market Strategist
Follow me on Twitter: @DColmanFX


