


US Dollar Talking Points
- The US Dollar has continued to advance, furthering the 2020 theme of strength.
- Hints of risk aversion have started to show this week, as discussed earlier regarding Gold prices.
US Dollar 2020 Strength Continues After a Brutal Q4
The fourth quarter of last year marked a change-of-pace in the US Dollar. The currency remained stubbornly strong through the first nine months of last year, even as the Federal Reserve shifted from a hawkish stance with four rate hikes in 2018 to a dovish stance with three cuts last year. But it wasn’t until the first day of Q4 that the US Dollar started to sell-off. The Greenback initially perched up to a fresh two-year-high; but October was a brutal month that saw sellers take-control and that theme came back with aggression in December as bears pushed prices down to fresh five-month-lows.
At this point, the first day of Q4 marks the recent high while the last day of Q4 marks the recent low: So far in 2020, price action has continued to bounce from that December 31st low and USD price action is currently testing a big zone of resistance that runs from 97.70-97.86. The former of those prices is a familiar level; this is the same price that set the high in November and December of 2018, along with March and June of 2019. The latter price of 97.86 is the 61.8% Fibonacci retracement of the 2017-2018 sell-off in DXY. Most recently, this zone caught lower-high resistance in DXY in late-December, just before those fresh five-month-lows came into play.
With USD bulls continuing to push through this week, the big question is whether they can muster the strength to push prices up to the next big area of resistance that rests from 98.33-98.50.
US Dollar Daily Price Chart
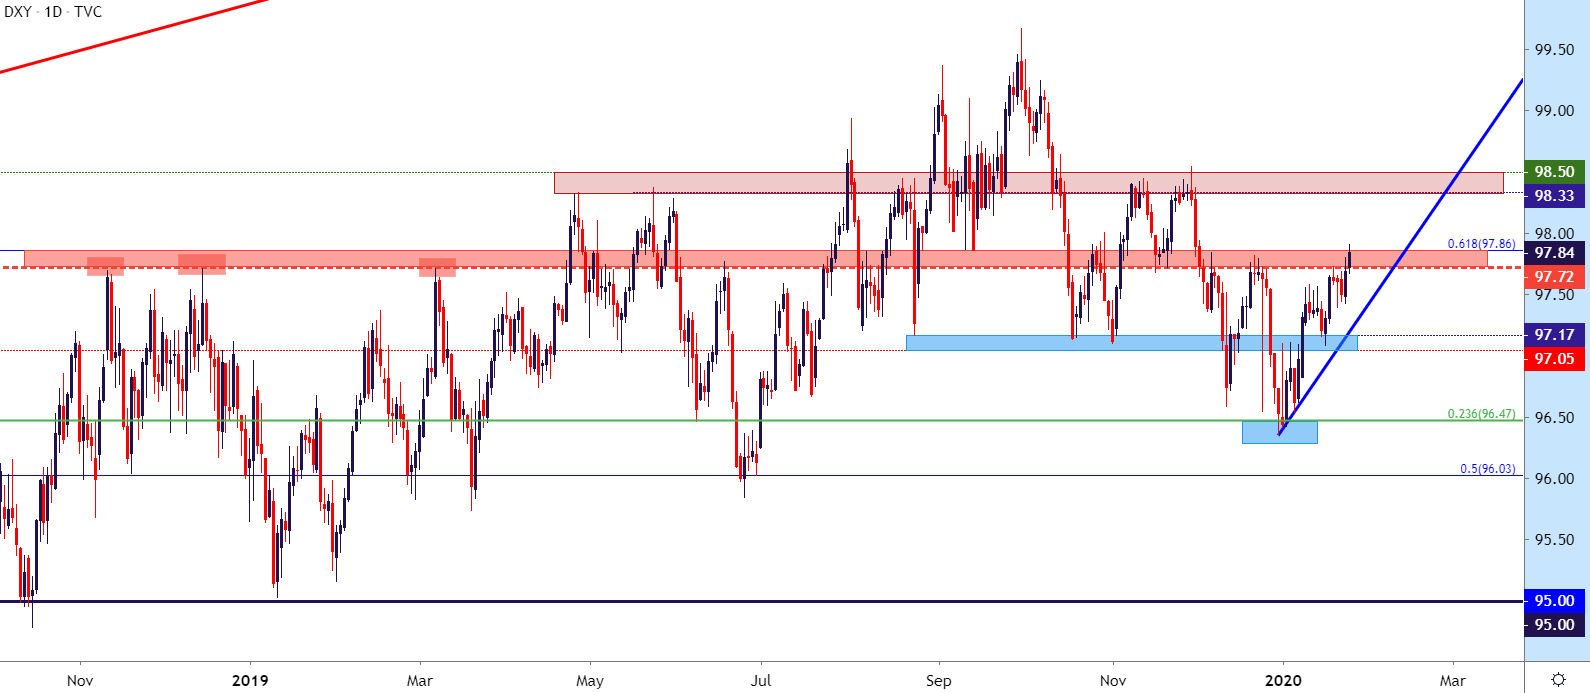
Chart prepared by James Stanley; US Dollar on Tradingview

Risk Aversion Potential
Notably, this week saw hints of risk aversion beginning to show, brought upon by fears of the Coronavirus that’s continuing to spread. This is indicated by the fact that all of the US Dollar, the Japanese Yen and Gold prices have all caught some element of bid as buyers have pushed strength into those markets. Regarding Gold, this could be especially interesting, as there appears to be a few factors favoring the bullish side of the matter, and most recently, fear has been helping to push prices higher.
But regarding FX markets, its also notable that this week’s USD-strength as seen in DXY was outmatched by strength in the anti-risk Yen; with USD/JPY sinking below a big zone of prior resistance, following last week’s breakout to fresh six-month-highs.
At this point, a big of resistance has started to show at a key area, taken from the 50% marker of the November 2017-March 2018 major move. This is the same price that caught multiple resistance inflections in November and December; and with USD/JPY bears making a re-entry into the equation, the short side of the pair may continue to correlate with risk aversion premises.
| Change in | Longs | Shorts | OI |
| Daily | 8% | 0% | 1% |
| Weekly | 2% | 4% | 3% |
USD/JPY Four-Hour Price Chart
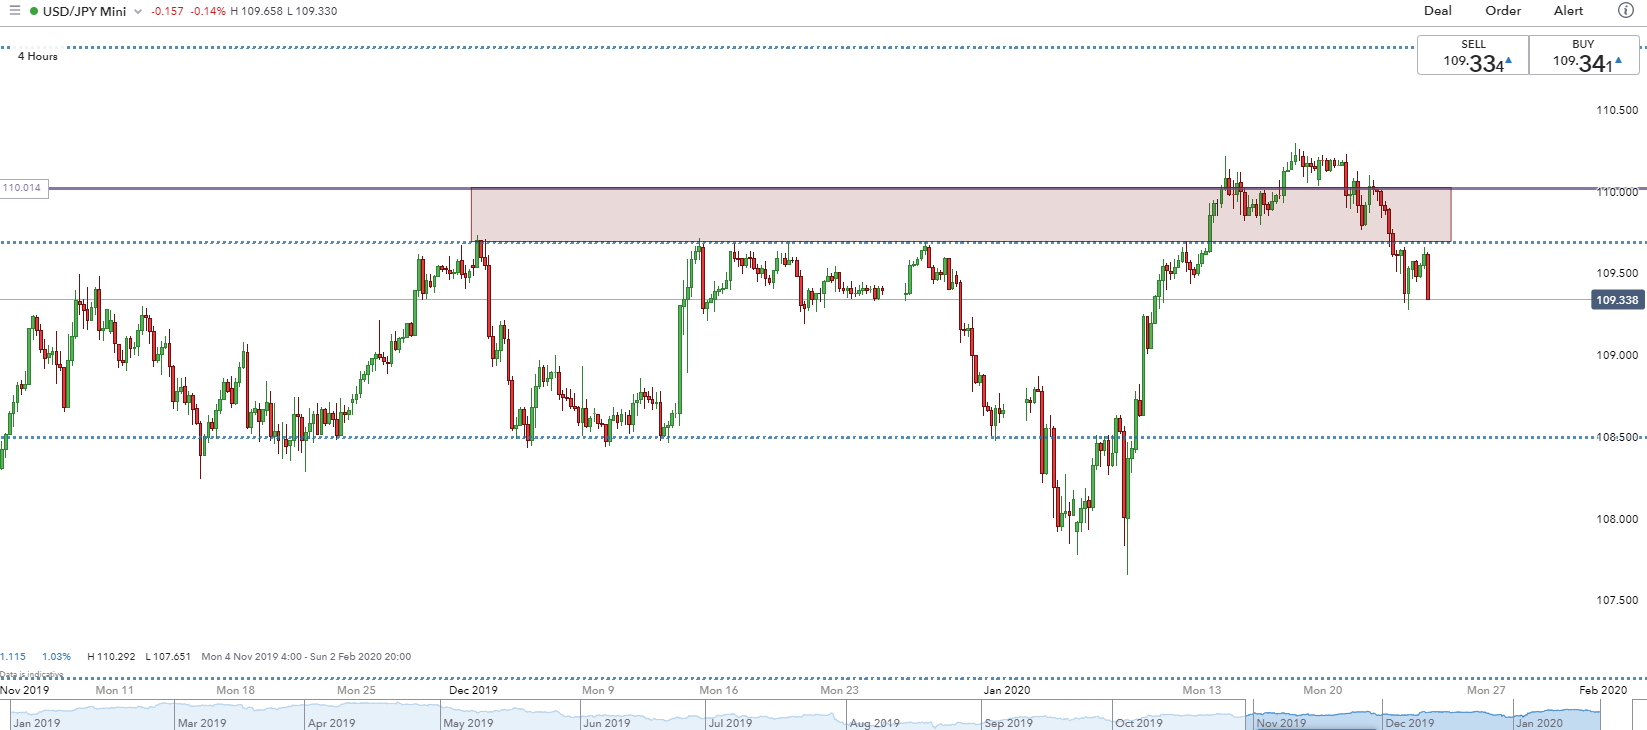
Chart prepared by James Stanley
--- Written by James Stanley, Strategist for DailyFX.com
Contact and follow James on Twitter: @JStanleyFX


