


Oil Price Talking Points:
- WTI Crude Oil prices jumped shortly after the open of the New Year, setting a fresh Eight-month high in the process, driven by fears of a continued heightening in Middle East tensions.
- Oil prices have since started to scale back, raising the question as to whether this flare of strength will turn-out similar to the spike seen in September after a Saudi oil field was attacked by a drone.
Crude Oil Prices Spike to Eight-Month High, Begin Pulling Back
WTI crude oil prices caught a significant bid shortly after the 2020 open, driven by the drone attack on Iranian General, Qassem Soleimani. Comments from President Trump after-the-fact threatened even more military action should Iran retaliate, and global markets have been waiting for the next item of fear to hit the headlines before continuing to push prices higher.
That hasn’t yet happened and as the first full week of the New Year gets underway oil prices have been giving back gains. This begs the question as to whether this recent flare of strength will be reminiscent of the September spike. Around that event, oil prices jumped-higher after a Saudi oil field was attacked by drones widely thought to have come from Iran. Around that event, oil prices cooled in the days after and two weeks later that spike was entirely priced-out of the market, and then some.

WTI Crude Oil Daily Price Chart
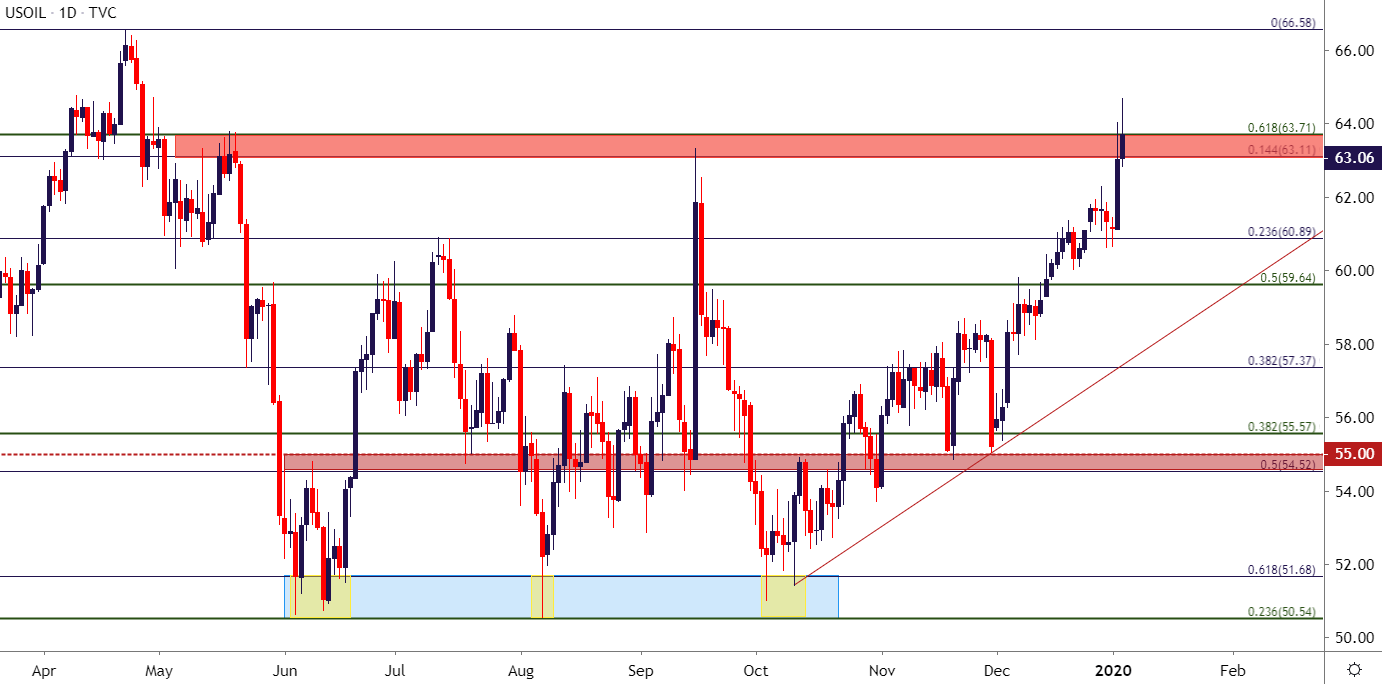
Chart prepared by James Stanley; Crude Oil on Tradingview
Crude Oil Prices: Force Meets Resistance
That bullish breakout in crude oil has run into a key area of resistance, spanning from 63.11-63.71. The latter of those levels comes from the 61.8% retracement of the Q4 2018 sell-off, while the former is the 14.4% marker of the recovery move that spans the December 2018 low up to the April 2019 high. This zone caught lower-high resistance in May of last year followed by a re-test around that September spike that was quickly faded-out of the market.
WTI Crude Oil Daily Price Chart

Chart prepared by James Stanley; Crude Oil on Tradingview
Crude Oil Price Strategy
Given the ramp-higher above a key area of resistance, combined with an overbought reading via RSI on the Daily chart, this could be a difficult area to chase oil prices higher. This would amount to an expectation for tensions to continue increasing around Iran and, in-turn, the Middle East. And while this is certainly possible if not plausible given the current backdrop, it’s also completely unpredictable, thereby producing an issue with timing such a move or theme.
At this point, from a technical perspective, sellers can look to a hold of resistance in this zone before investigating fades or short-term reversal strategies. This would be based around the similar occurrence that took place a few months ago in September, when a quick grip of fear put pressure on the bid as prices spiked up to fresh highs. But that strength slowly dissipated in the days and weeks after, and early-October saw price action fall all the way down to the support area in the 50.54-51.68 area.
From the hourly chart below, we can see where WTI crude oil prices have already filled the gap from this week’s open as price action has begun to tip-toe lower, testing below the 63.11 Fibonacci level. This keeps focus on the 63.95-64.04 area, watching for sellers to hold the highs below this zone in order to keep the door open for short-term bearish strategies.
| Change in | Longs | Shorts | OI |
| Daily | 8% | -7% | 3% |
| Weekly | -8% | 7% | -4% |

Chart prepared by James Stanley; Crude Oil on Tradingview
--- Written by James Stanley, Strategist for DailyFX.com
Contact and follow James on Twitter: @JStanleyFX


